I Sent Cloudflare AI Gateway OTel Spans to Grafana Tempo. Success Spans Arrived, Error Spans Did Not
I sent OpenTelemetry spans from Cloudflare AI Gateway and a Node.js agent to Grafana Tempo under the same trace ID, then compared a successful response, a client timeout, an invalid model error, and a fallback. The results reveal missing error spans, different duration boundaries across the app, Gateway logs, and OTel spans, and the need for a separate observation point for response quality.
Using Tempo to See Agent Wait Time That AI Gateway Logs Cannot Explain
In an earlier verification, I confirmed that Cloudflare AI Gateway logs retain the model, status, duration, tokens, cost, prompt, and response. These logs are useful for investigating what happened at the LLM boundary.
They are not enough, however, to explain why the agent as a whole was slow.
How many milliseconds did planning take before the LLM call? How long did the agent pause before deciding to fall back after a failure? How much of the user’s wait occurred outside AI Gateway? A single Gateway request log cannot place these events on the same timeline.
I therefore collected Cloudflare AI Gateway’s OTel span and application-side agent spans in Grafana Tempo. The goal was not to produce more logs, but to connect the causal chain into one trace.
The successful path connected as expected. The failure paths had gaps. More unexpectedly, the three durations that should have described the same LLM call differed substantially.
That discrepancy became the most concerning result of this verification.
Sending Node.js Agent and AI Gateway Spans to Tempo Under One Trace ID
I ran this verification on July 18, 2026. A small Node.js 22 agent script called Workers AI’s @cf/meta/llama-3.1-8b-instruct-fast model through AI Gateway. I stored the traces in a local Grafana Tempo 2.8.2 instance and viewed them in Grafana 12.1.0.
The setup looked like this:
Node.js Agent
  ├─ agent.run / agent.plan / llm.call ──OTLP──┐
  │                                             │
  └─ Cloudflare AI Gateway ── Workers AI        ├─ Grafana Tempo
          └─ cf.aig.request ──OTLP──Auth Proxy──┘
Cloudflare’s AI Gateway OTel integration accepts an OTLP/JSON or OTLP/Protobuf destination URL, a Content-Type, and additional headers. Rather than exposing the local Tempo receiver directly, I placed an authentication proxy in front of a short-lived tunnel. The proxy forwarded requests to /v1/traces only when a verification header matched.
The input was limited to a fixed, short verification prompt. I did not store the API token, Account ID, tunnel URL, or authentication header value in the artifacts. After the verification, I restored the dedicated Gateway’s OTel exporter configuration to its original state with zero exporters.
Passing the Span Parent-Child Relationship with Cloudflare Headers
Cloudflare defines two HTTP headers for passing trace context to AI Gateway:
const headers = {
  "cf-aig-otel-trace-id": traceId,       // 32-character hex
  "cf-aig-otel-parent-span-id": spanId, // 16-character hex
};
On the application side, agent.run is the root span and llm.call is one of its children. When I put the trace ID and span ID from llm.call into these headers, AI Gateway’s cf.aig.request arrived in Tempo as a child span.
Matching the trace context was not sufficient on its own. The first request stopped with a 401 and Cloudflare error code 10000. The API token could write AI Gateway settings, but it did not have permission to run Workers AI. Permission to configure the Gateway exporter and permission to call the model behind the Gateway are separate.
Confirming Four Spans in a Successful Agent Request
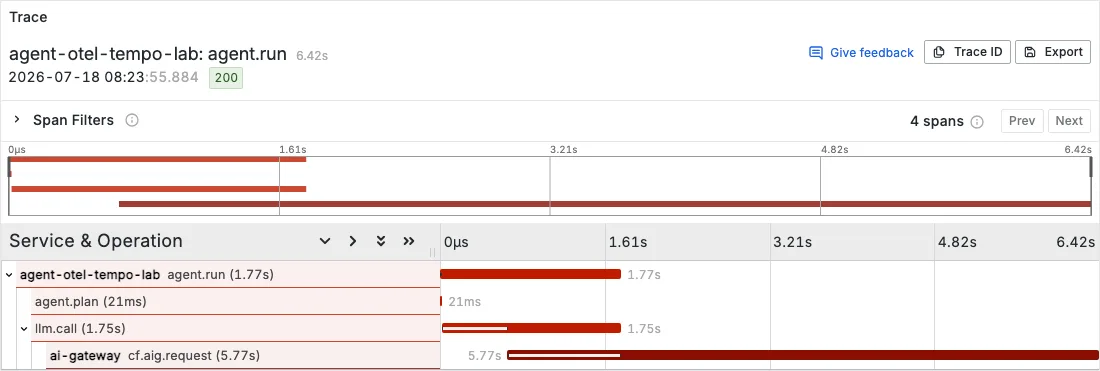
The successful trace contained four spans:
agent.run
├─ agent.plan
└─ llm.call
   └─ cf.aig.request
The application emitted agent.run and llm.call, while AI Gateway emitted cf.aig.request. Tempo showed two services, agent-otel-tempo-lab and ai-gateway, but preserved the parent-child relationship between their spans.
This trace makes it possible to compare agent planning, the time the application spent waiting for the LLM call, and the GenAI span sent by AI Gateway on one screen. At minimum, the vague symptom “the agent is slow” can now be decomposed into processing stages.
The diagram also raises another question. The root agent.run span ended after 1.77 seconds, while its apparent child, cf.aig.request, lasted 5.77 seconds. The child is longer than the parent.
Comparing Spans and Gateway Logs for Timeout and Invalid Model Failures
I ran two failure cases with the same setup:
- Abort from the client after 300 milliseconds
- Trigger a
400with a nonexistent model, then fall back to a valid model
The results were as follows:
| Case | Application span | AI Gateway log | AI Gateway OTel span |
|---|---|---|---|
| Successful response | Recorded as successful | Present | Present |
| 300ms timeout | Recorded as client-timeout | Not found | Not found |
| Nonexistent model | Recorded as 400 / cloudflare-5007 | Present | Not found |
| Successful fallback response | Recorded as successful | Present | Present |
For the timeout, the application span recorded that the client aborted after 304 milliseconds. However, there was no AI Gateway span under the same trace ID, and I could not find the corresponding request in the Gateway logs.
The nonexistent model behaved differently. The application received a 400 after 1,877 milliseconds, and the AI Gateway logs contained a status 400 entry with a duration of 1,713 milliseconds. Even so, the cf.aig.request span did not arrive in Tempo.
The subsequent 32-millisecond fallback decision and the 364-millisecond second call to the valid model remained in the application spans. Only the second call also had an AI Gateway span in the same trace.
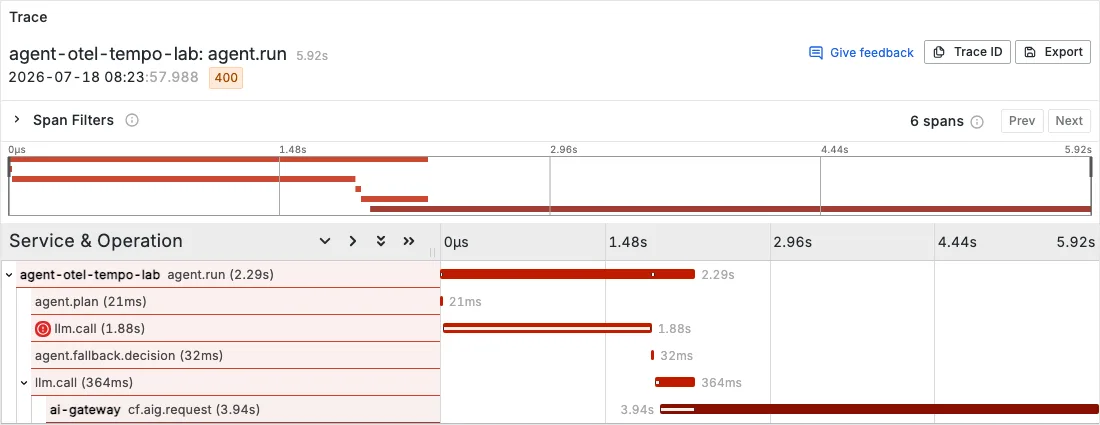
Under these test conditions, “the request exists in AI Gateway logs” and “a span arrived from the OTel exporter” were not equivalent. Using Tempo as the sole source of truth for error counts would miss the invalid model error. Looking only at the application, on the other hand, would hide Gateway-internal attributes.
For failure investigation, it is safer to treat application spans, AI Gateway logs, and OTel spans as three different observation sources.
Comparing Duration Across the Application, Gateway Logs, and OTel Spans
The earlier concern about a child span outlasting its parent became clearer when I placed the three duration values side by side.
| Call | Application llm.call | AI Gateway log | cf.aig.request span |
|---|---|---|---|
| Successful response | 1,747ms | 1,088ms | 5,766ms |
| Fallback destination | 364ms | 302ms | 3,943ms |
The application duration runs from starting the HTTP request to finishing the response body. The AI Gateway log duration was shorter, while the OTel span continued after the application had received its response.
This single verification cannot establish which Cloudflare-internal process created the difference. The exporter timing or the measurement boundaries may differ. It does establish that the cf.aig.request duration cannot be treated directly as the user’s wait time.
It is more natural to measure a user-facing SLO with application-side spans and use AI Gateway spans for Gateway processing and GenAI attributes.
Inspecting GenAI Attributes and Missing Evaluation Data
Even if its duration cannot represent user wait time, the AI Gateway span carries other information. The spans received in this verification included these GenAI attributes:
gen_ai.operation.namegen_ai.request.modelgen_ai.provider.namegen_ai.usage.input_tokensgen_ai.usage.output_tokensgen_ai.usage.costgen_ai.input.messagesgen_ai.output.messages- The
app,env, andcasefields supplied to the exporter
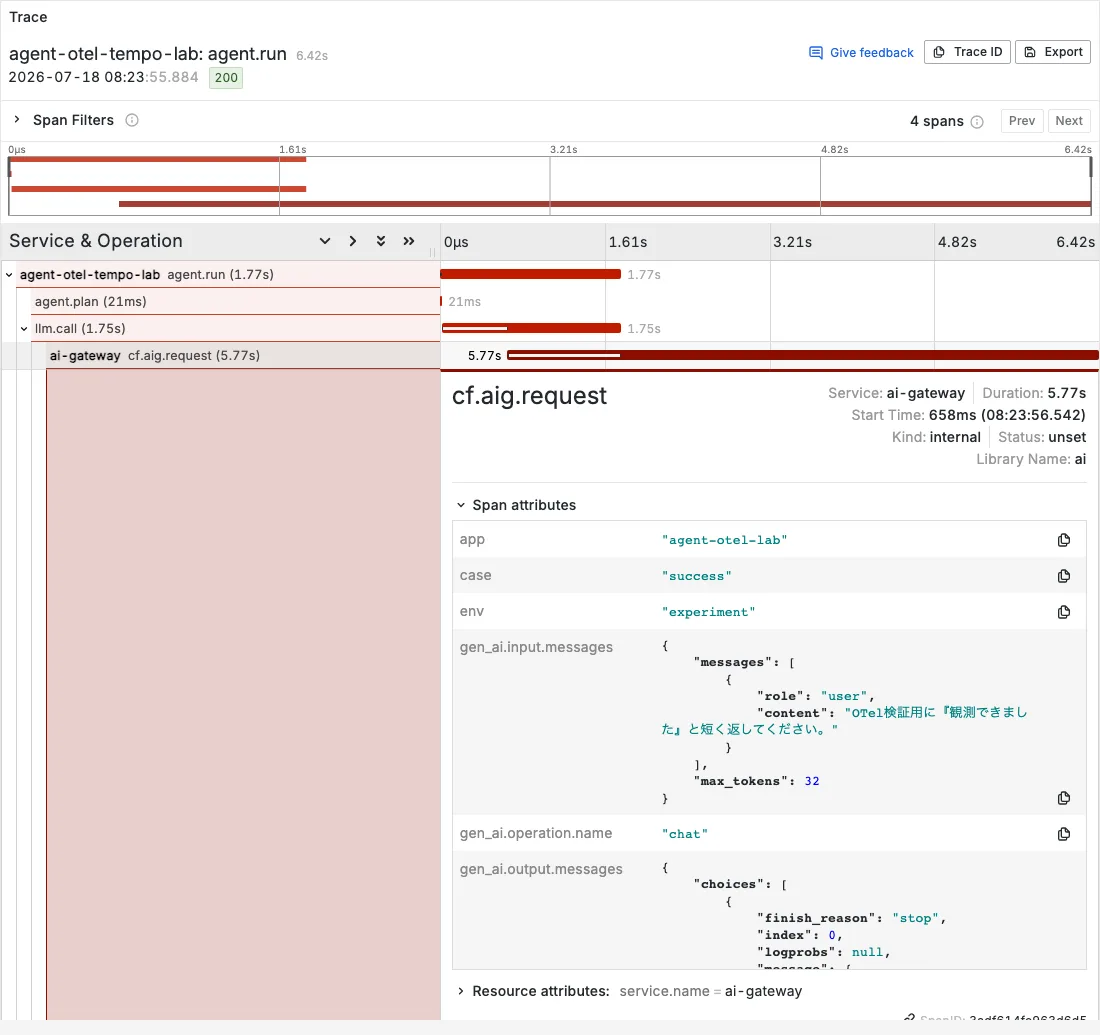
Two details require attention: the attribute names and the scope of stored input and output content.
First, the Cloudflare documentation available during the verification listed gen_ai.model.provider, gen_ai.prompt_json, and gen_ai.completion_json, while the data I actually received used gen_ai.provider.name, gen_ai.input.messages, and gen_ai.output.messages. The latter names follow the current OpenTelemetry GenAI attribute registry. Before fixing dashboards or TraceQL queries to particular attribute names, it is worth inspecting the data that actually arrives.
Second, the input and output bodies appear in span attributes. The OpenTelemetry specification also warns that message attributes may contain sensitive or personally identifiable information. The ability to send content to Tempo does not mean that storing it is acceptable. Retention, access permissions, and masking must be decided first.
The span also contained no information explaining response quality. There were zero scores, labels, or reasons corresponding to gen_ai.evaluation.*.
This is not a defect in Tempo. AI Gateway can observe the model call that passes through the Gateway. Decisions such as “does the response answer the question?” or “is the fallback response acceptable?” depend on information held by the application or an evaluator. Unless those results are added as custom spans or attributes, they will not appear in Tempo.
Separating the Roles of Tempo and Langfuse
It would be premature to conclude that missing quality evaluations mean Langfuse should replace Tempo. The results suggest assigning roles according to the question being investigated rather than always choosing one platform.
| Question | Suitable observation source |
|---|---|
| Latency across APIs, databases, queues, and LLMs | OpenTelemetry + Tempo |
| Processing order for timeout, retry, and fallback | Application spans + Tempo |
| Model, tokens, and cost at the AI Gateway boundary | AI Gateway logs / OTel spans |
| Prompt, completion, evaluation score, and evaluation reason | An LLM evaluation platform such as Langfuse, or application-side evaluation spans |
| Complete count of failed requests | Application logs together with AI Gateway logs |
If an existing service already uses OpenTelemetry, adding AI Gateway spans to Tempo has substantial value. LLM calls can be investigated on the same timeline as APIs and databases rather than being isolated in a separate interface.
If the goal is to evaluate response quality continuously and manage prompt versions, datasets, scores, and feedback, building the operational view with generic traces alone takes more work. An LLM-oriented data model such as Langfuse’s is helpful in that area.
I would use Tempo as the main view for system latency and incident investigation, and Langfuse as the main view for response quality and evaluation loops. Instead of duplicating every message body into both systems, I would begin by sharing a trace ID so operators can move between them when necessary.
Choosing Observation Sources for Success, Failure Counts, and Response Quality
Tempo decomposed the agent’s total wait time, which AI Gateway logs alone could not explain, into processing stages. For a successful response, the application’s llm.call and the Gateway’s cf.aig.request joined one trace, placing agent planning, LLM wait time, and fallback decisions on the same timeline.
However, the AI Gateway spans for the timeout and invalid model error were missing in this verification. The OTel span duration also differed from both application wait time and the duration in AI Gateway logs. One clean successful trace is not enough to make Tempo the sole monitoring source.
Tempo revealed where processing traveled, where it waited, and where it failed. It did not reveal why a response was judged good or bad.
Latency traces and quality evaluations may look similar, but they are separate observations. AI Gateway OTel connects the former to an existing tracing platform; failure logs and evaluation results need other observation points. A connected trace is not proof that observability is complete.