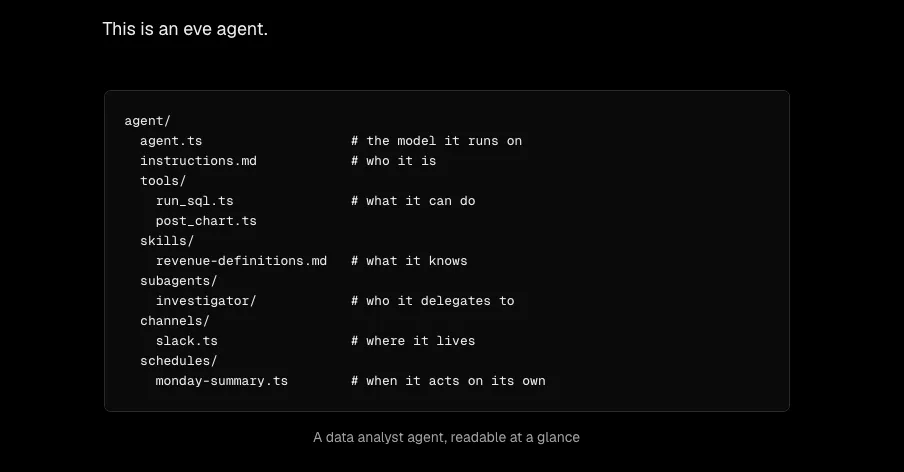
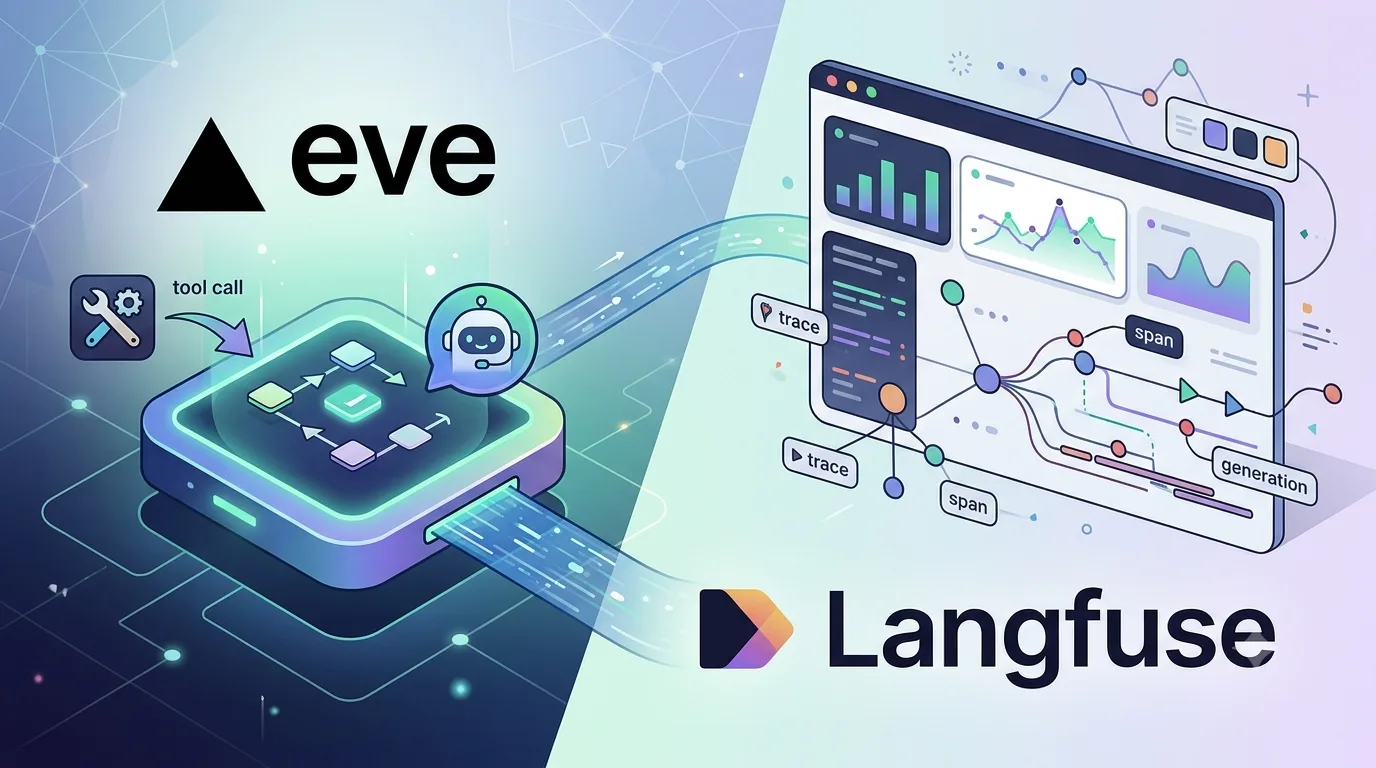
Observing Eve TUI Execution and Tool Calls with Langfuse
A hands-on comparison of two ways to send Eve tool-calling executions to Langfuse as trace/span/generation data.
Why the TUI alone isn’t enough
In the previous article — “Building a tool-equipped agent with Vercel Eve and running it from the TUI” — I added a get_weather tool, confirmed its invocation in the eve dev TUI, ran an eval that failed once on includes("partly cloudy"), and fixed the expectation.
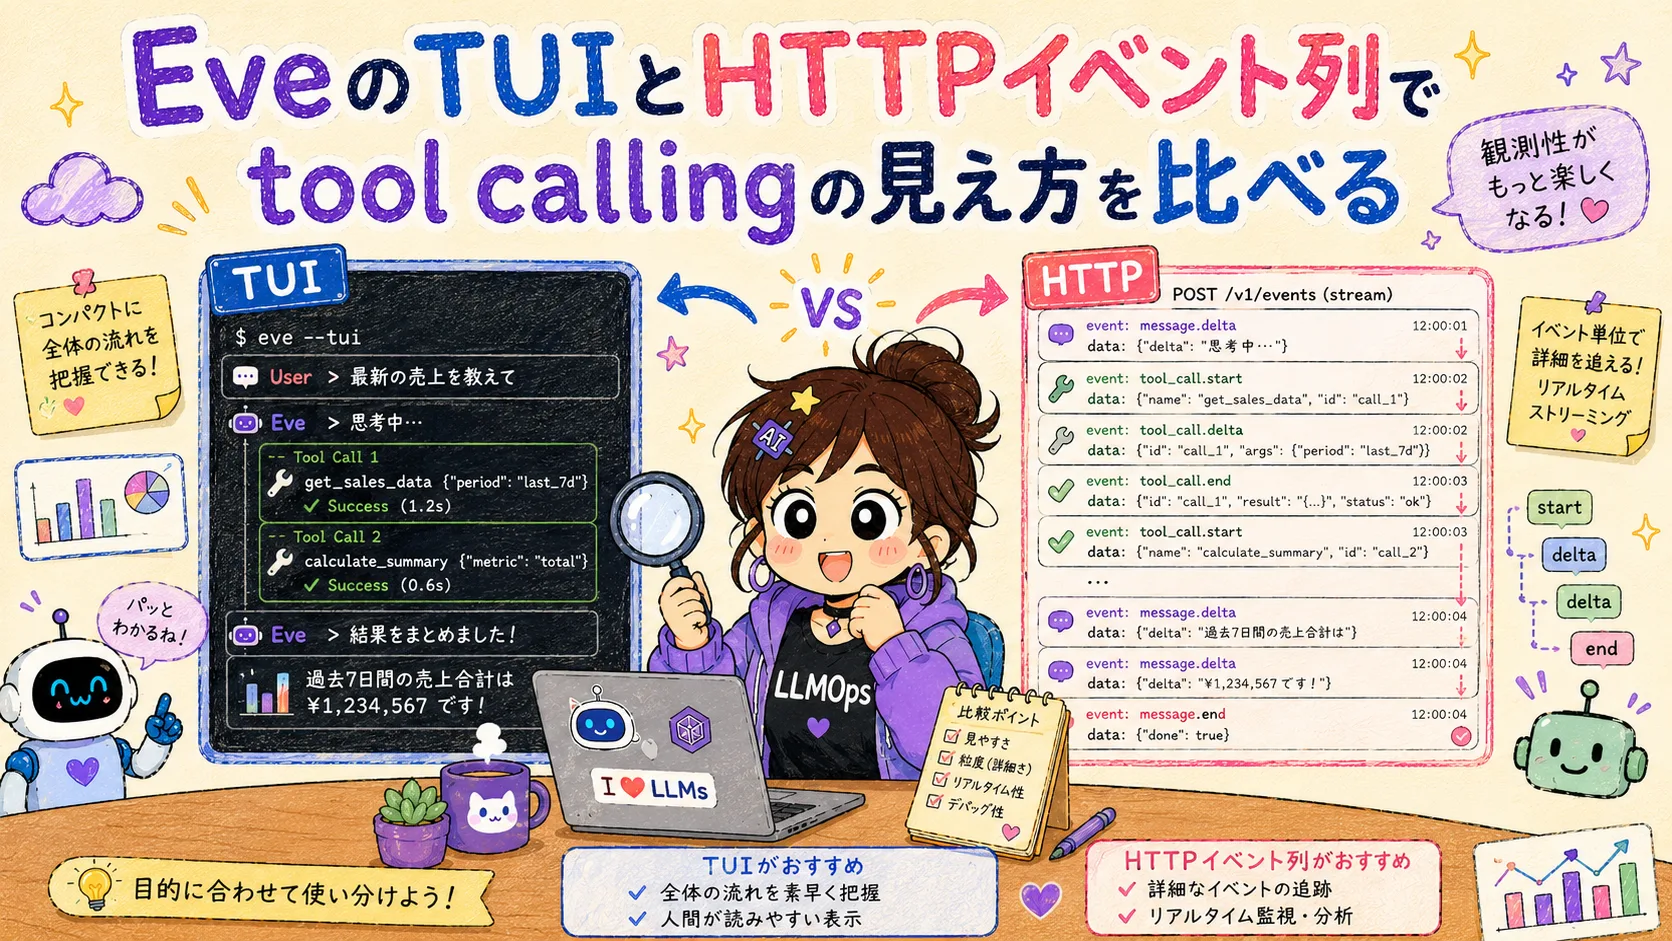
The TUI shows the reasoning process and tool calls in real time, which made for a fairly comfortable development experience.

But the TUI only shows what’s happening right in front of you right now. From an LLMOps perspective, this is nothing more than on-the-spot observation. To look back later and compare “when, with which model, which tool was called, and which eval failed,” you need to persist records in an external observability platform, separate from the TUI logs.
This time, I used Langfuse as that recording destination and built a minimal setup to send Eve’s execution as trace/span/generation.
Where to collect records: two options
The first hurdle was the entry point: where to hook recording code into Eve. Re-reading the docs, I found there are roughly two choices.
- Using
instrumentation.tsor hooks: Observing events from the outside against Eve’s execution lifecycle of sessions, turns, and steps - Embedding recording code directly inside the tool definition’s
executefunction: Calling the Langfuse SDK directly inside your own tools (get_weather.ts, etc.)
I tried both.
Following Eve’s own lifecycle means you shouldn’t have to rewrite recording code every time you add a tool, so I felt the instrumentation.ts / hook approach was probably the “right” way.
Option 1: Trying instrumentation.ts and hooks
At first I was only looking at stream events like input.requested, so I was confused about where to pick up tool call start and end events.
But instead of stopping there, I traced the type definitions inside Eve’s package and found the entry point was indeed there.
First, Eve provides a file-based entry point called agent/instrumentation.ts.
Exporting defineInstrumentation here enables telemetry for model calls, and you can add runtimeContext to pass to the AI SDK telemetry span via step.started.
import { OTLPTraceExporter } from "@opentelemetry/exporter-trace-otlp-http";
import { resourceFromAttributes } from "@opentelemetry/resources";
import { NodeSDK } from "@opentelemetry/sdk-node";
import { ATTR_SERVICE_NAME } from "@opentelemetry/semantic-conventions";
import { defineInstrumentation } from "eve/instrumentation";

function getLangfuseAuthorizationHeader() {
  const publicKey = process.env.LANGFUSE_PUBLIC_KEY;
  const secretKey = process.env.LANGFUSE_SECRET_KEY;
  if (!publicKey || !secretKey) return undefined;

  return "Basic " + Buffer.from(`${publicKey}:${secretKey}`).toString("base64");
}

function getLangfuseOtelEndpoint() {
  if (process.env.LANGFUSE_OTEL_ENDPOINT) {
    return process.env.LANGFUSE_OTEL_ENDPOINT;
  }

  const baseUrl = process.env.LANGFUSE_BASE_URL ?? "https://cloud.langfuse.com";
  return baseUrl.replace(/\/$/, "") + "/api/public/otel/v1/traces";
}

export default defineInstrumentation({
  functionId: "vercel-eve-langfuse-observability",
  recordInputs: true,
  recordOutputs: true,
  setup({ agentName }) {
    const authorization = getLangfuseAuthorizationHeader();
    if (!authorization) return;

    const sdk = new NodeSDK({
      resource: resourceFromAttributes({
        [ATTR_SERVICE_NAME]: agentName,
      }),
      traceExporter: new OTLPTraceExporter({
        url: getLangfuseOtelEndpoint(),
        headers: {
          Authorization: authorization,
          "x-langfuse-ingestion-version": "4",
        },
      }),
    });

    sdk.start();
  },
  events: {
    "step.started"(event) {
      return {
        runtimeContext: {
          "langfuse.trace.name": "eve-session",
          "langfuse.session.id": event.session.id,
          "langfuse.trace.metadata.experiment": "vercel-eve-langfuse-observability",
          "langfuse.trace.metadata.turn_id": event.turn.id,
          "langfuse.trace.metadata.step_index": event.step.index,
        },
      };
    },
  },
});
I added this file to the experimental environment’s agent/instrumentation.ts.
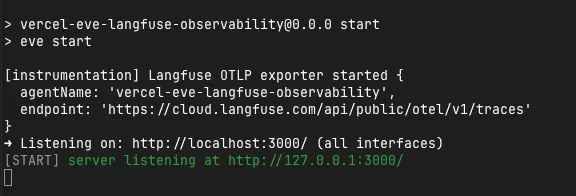
Starting the server with npm run start also started the OTLP exporter.
[instrumentation] Langfuse OTLP exporter started {
  agentName: 'vercel-eve-langfuse-observability',
  endpoint: 'https://cloud.langfuse.com/api/public/otel/v1/traces'
}
I could also subscribe to action.result on the hook side.
This event fires after tool, sub-agent, or skill execution results are finalized.
Using toolResultFrom, you can extract only the result corresponding to a specific tool definition.
import { defineHook } from "eve/hooks";
import { toolResultFrom } from "eve/tools";
import getWeather from "#tools/get_weather";

export default defineHook({
  events: {
    "action.result"(event, ctx) {
      const result = toolResultFrom(event.data.result, getWeather);
      if (!result) return;

      console.info({
        hook: "action.result",
        agent: ctx.agent.name,
        channel: ctx.channel.kind ?? "unknown",
        toolName: result.toolName,
        callId: result.callId,
        output: result.output,
        status: event.data.status,
      });
    },
  },
});
So my initial assumption that “hooks and stream events can’t capture tool calls” was shallow.
At least in Eve 0.11.9, there’s instrumentation.ts as a standard observability entry point, and action.result as a result event.
So did this actually reach Langfuse? The first verification runs got stuck due to insufficient AI Gateway credentials or a Langfuse 401, but after fixing the auth and rerunning, I reached Eve’s tool call.
The node scripts/send-turn.mjs used here isn’t a command that comes with Eve out of the box; it’s a small script I prepared for this verification.
All it does is send one turn via the Eve Client to the running Eve server (http://127.0.0.1:3000).
import { Client } from "eve/client";
const client = new Client({ host: process.env.EVE_HOST ?? "http://127.0.0.1:3000" });
const session = client.session();
const response = await session.send("東京の天気を教えてください。ツールを使ってください。");
const result = await response.result();
console.log(JSON.stringify({
status: result.status,
sessionId: result.sessionId,
message: result.message,
events: result.events.map((event) => event.type),
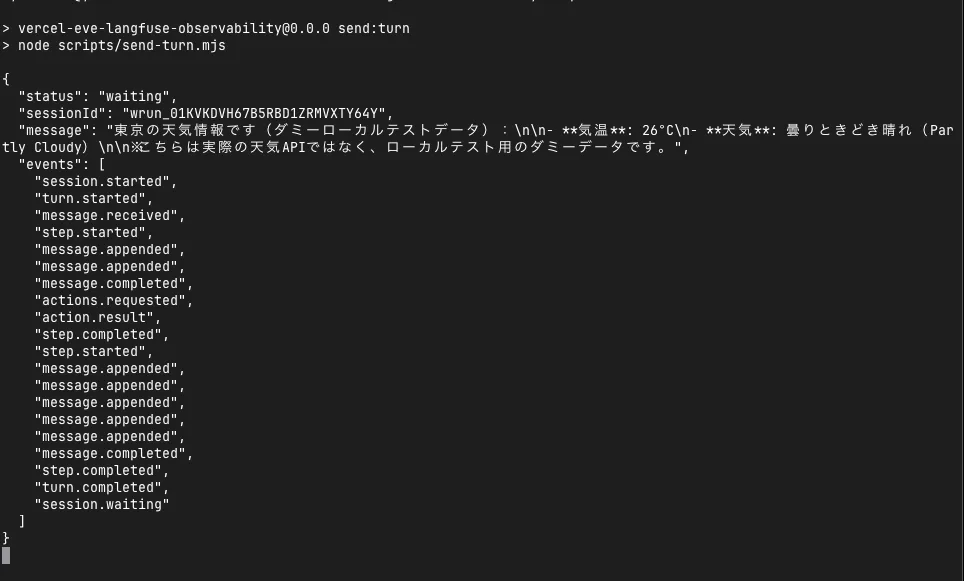
}, null, 2));I could enter manually in the TUI, but since I wanted to throw the same input every time for screenshots and reruns, I used this script.
The execution output shows actions.requested and action.result.
This indicates that Eve requested a get_weather call and received its result.
"actions.requested",
"action.result",
"session.waiting"
The last event being session.waiting rather than session.completed is because the conversation session remains waiting for the next input.
For the purposes of this observability test, seeing actions.requested and action.result is enough.
Option 2: Embedding recording code inside the tool’s execute
As a comparison, I also tried another naive approach.
This involves calling the Langfuse SDK directly inside the execute function of agent/tools/get_weather.ts.
Rather than riding Eve’s lifecycle, this approach places observability code inside the tool implementation you wrote yourself.
import { Langfuse } from "langfuse";
const langfuse = new Langfuse();
export default defineTool({
description: "指定した都市の天気を取得する",
inputSchema: z.object({
city: z.string(),
}),
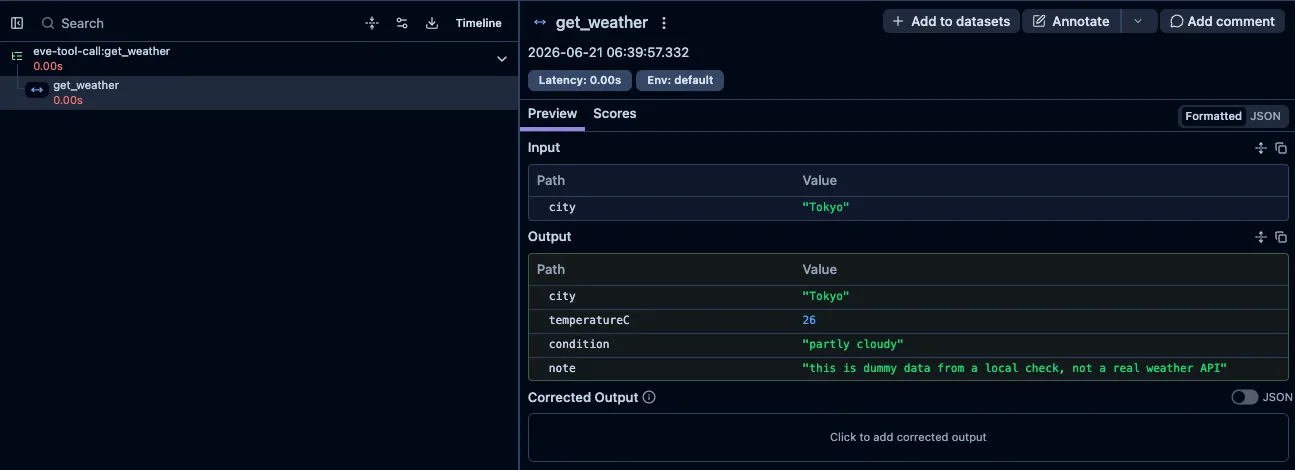
execute: async ({ city }, ctx) => {
const trace = langfuse.trace({
name: "eve-tool-call",
sessionId: ctx.session.id,
metadata: {
tool: "get_weather",
model: ctx.session.model, // model IDが取れる場合
},
});
const span = trace.span({
name: "get_weather",
input: { city },
});
const result = await fetchWeather(city);
span.end({ output: result });
await langfuse.flushAsync();
return result;
},
});This worked. But the moment it worked, another problem became apparent.
Writing observability code on the tool side means copying the same boilerplate every time you add a tool. That’s pretty painful.
With just one tool it’s no big deal, but as you grow to 5 or 10, you’d be duplicating langfuse.trace() calls and flush logic across every tool.
To share it, creating a thin helper that wraps execute and routing every tool through it seems reasonable.
function withLangfuseTrace(toolName: string, execute: ToolExecute): ToolExecute {
  return async (input, ctx) => {
    const trace = langfuse.trace({
      name: `eve-tool-call:${toolName}`,
      sessionId: ctx.session.id,
    });
    const span = trace.span({ name: toolName, input });
    try {
      const result = await execute(input, ctx);
      span.end({ output: result });
      return result;
    } catch (err) {
      span.end({ output: { error: String(err) }, level: "ERROR" });
      throw err;
    } finally {
      await langfuse.flushAsync();
    }
  };
}
In this verification, the thin-wrapper-on-the-tool-side approach was the shortest to implement.
On the other hand, if you align with Eve’s design, the instrumentation.ts + OTel exporter approach that captures events from the outside is the real answer.
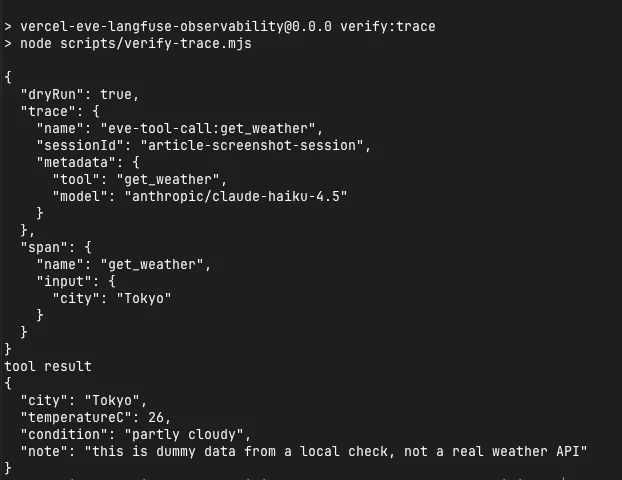
For comparison, I also confirmed actual transmission with the tool-side adapter via the Langfuse SDK.
Because running through the Eve server would mix with OTel traces, I prepared a small script that directly calls get_weather’s execute for verification.
This script enables withLangfuseTrace with LANGFUSE_TRACE_ENABLED=true, sending traceName as eve-tool-call:get_weather and sessionId as tool-adapter-check-....
npm run verify:tool-adapterThe execution result looked like this.
{
  "ok": true,
  "traceName": "eve-tool-call:get_weather",
  "sessionId": "tool-adapter-check-2026-06-20T21:36:09.106Z"
}
Comparison so far
Initially I hit 401s because my Langfuse credentials were off, but after fixing them I confirmed trace transmission via both OTel and SDK paths.
If you just need to write and send quickly, the tool-side adapter is fastest.
But if you’re doing this properly with the expectation of adding more tools, the instrumentation.ts + OTel setup that captures from the outside seems more maintainable than mixing recording logic into individual execute functions.
Hook’s action.result seemed best used as a place to create custom logs or auxiliary analysis events, rather than as the place to generate Langfuse traces themselves.
Storing model ID and eval results in metadata
In the trace metadata, I placed the model ID (something like anthropic/claude-haiku-4.5) in the model field, along with sessionId.
This lets me later filter by calling trends per model in Langfuse.
As for eval results, eve eval runs and interactive TUI runs are separate processes, so I haven’t yet tied eval success/failure to the same trace.
To send from the eval runner side as well, you’d need similar trace calls inside the test code under evals/, which is one of the next things I want to try.
What became visible in Langfuse
After the send:turn run, Eve-originated traces also appeared in Langfuse’s trace list.
What’s important here is that the traces landing in Langfuse aren’t just somehow increasing; you can search them tied to Eve sessions.
The sessionId that appeared in the send:turn output is the conversation session ID issued by Eve.
wrun_01KVKDVH67B5RBD1ZRMVXTY64YIn instrumentation.ts, I pass this value into the span as langfuse.session.id.
Therefore, on the Langfuse side, you can find this run not only by trace name but also by session ID and metadata.
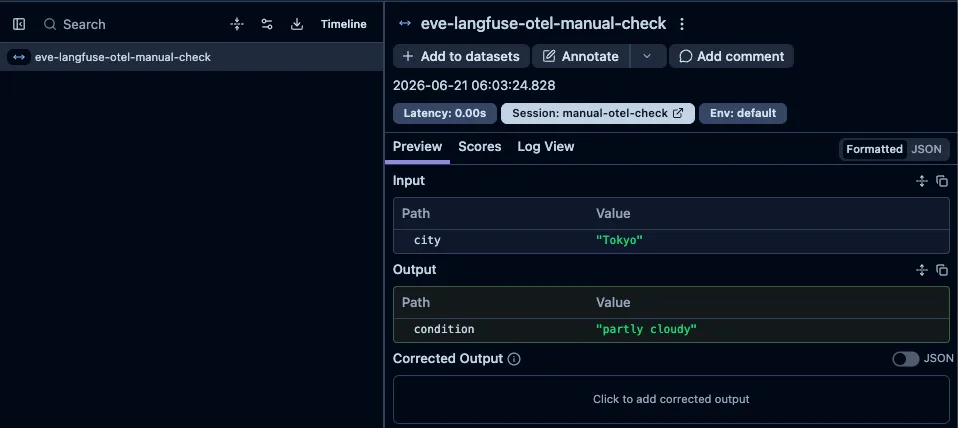
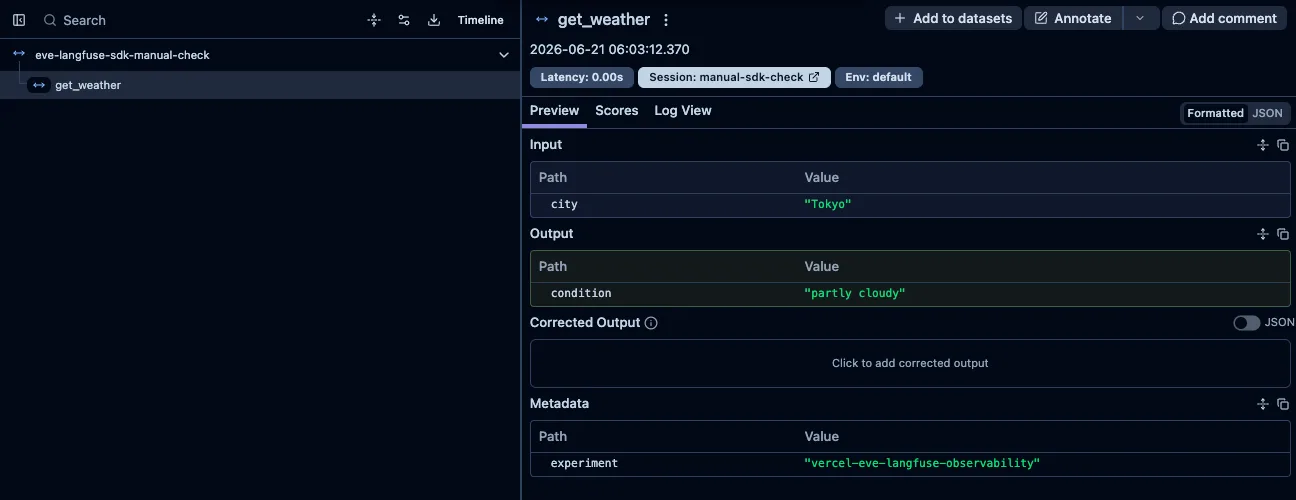
Opening the trace detail, you can verify the runtime context injected via step.started, such as langfuse.session.id and langfuse.trace.metadata.experiment.
In this configuration, the hook’s action.result is treated as console logs, and I’m not explicitly creating a dedicated get_weather tool I/O span in Langfuse.
Thus, the main things to check in Langfuse detail aren’t so much the tool output itself, but the metadata that ties the Eve execution to the Langfuse trace.
I wouldn’t have noticed this just by glancing at logs on a screen, but lining them up in the trace list, you can see the wording returned for the same city varies subtly per call. That’s a quiet discovery.
That was the biggest takeaway this time. The “output variance for the same input,” which I hadn’t noticed when viewing one at a time in the TUI, became visible only by comparing multiple runs side by side. This is fundamentally hard to do in a TUI, and I feel this is exactly the point of inserting an accumulation-based observability platform like Langfuse.
The redaction design is still provisional
How far to record user input and tool results was left as a provisional design this time.
The dummy tool used here (weather fetching) doesn’t handle sensitive data, but if you apply the same mechanism to an agent handling internal data, you shouldn’t send the output passed to span.end() as-is; you’d need to insert a layer that masks fields individually.
As a tentative policy for now:
- For tool inputs, don’t send fields that could be user identifiers or personal information
- For tool outputs, keep only the structural key names and reduce values to type information only
- Use Langfuse’s field-level encryption and masking features as needed
This is the tentative framing, but it’s still hypothetical. I think you can’t get a feel for how much to trim until you operate in scenarios involving actual PII.
What I learned, and what I still don’t know
Here’s what I learned from this verification.
- In Eve 0.11.9, you can capture
step.startedinagent/instrumentation.tsand addruntimeContextto the AI SDK telemetry span - You can subscribe to
action.resultinagent/hooks/*.tsand extract specific tool execution results withtoolResultFrom - With the
instrumentation.ts+ OTLP exporter setup, you can send Eve execution traces to Langfuse - In a
send:turnrun,actions.requestedandaction.resultappear, reaching the tool call request and result - In Langfuse trace detail, you can verify the link between the Eve execution and the trace via
langfuse.session.idandlangfuse.trace.metadata.experiment - Since this hook is for console logging, additional implementation is needed to create a dedicated
get_weathertool I/O span in Langfuse
What remains unresolved:
- How to record
action.resultcontents as an independent span or event in Langfuse - How to tie
eve evaland TUI execution traces together as the same session - Validity of redaction rules in actual production operation
Next, I’d like to add a thin layer that converts the action.result captured by the hook into spans or events on the Langfuse side.
Once that’s done, you can have a setup where instrumentation.ts in Eve itself captures model execution, and hooks complement it with tool results.