Reassessing My Morning Briefing Worker Now That Langfuse Monitors Has Arrived
I compare Langfuse Monitors with my custom Slack morning briefing worker to figure out which responsibilities should move to the official feature and which should stay custom.
This article is part of " Langfuse Morning Briefing " series (Part 3) — 3 posts
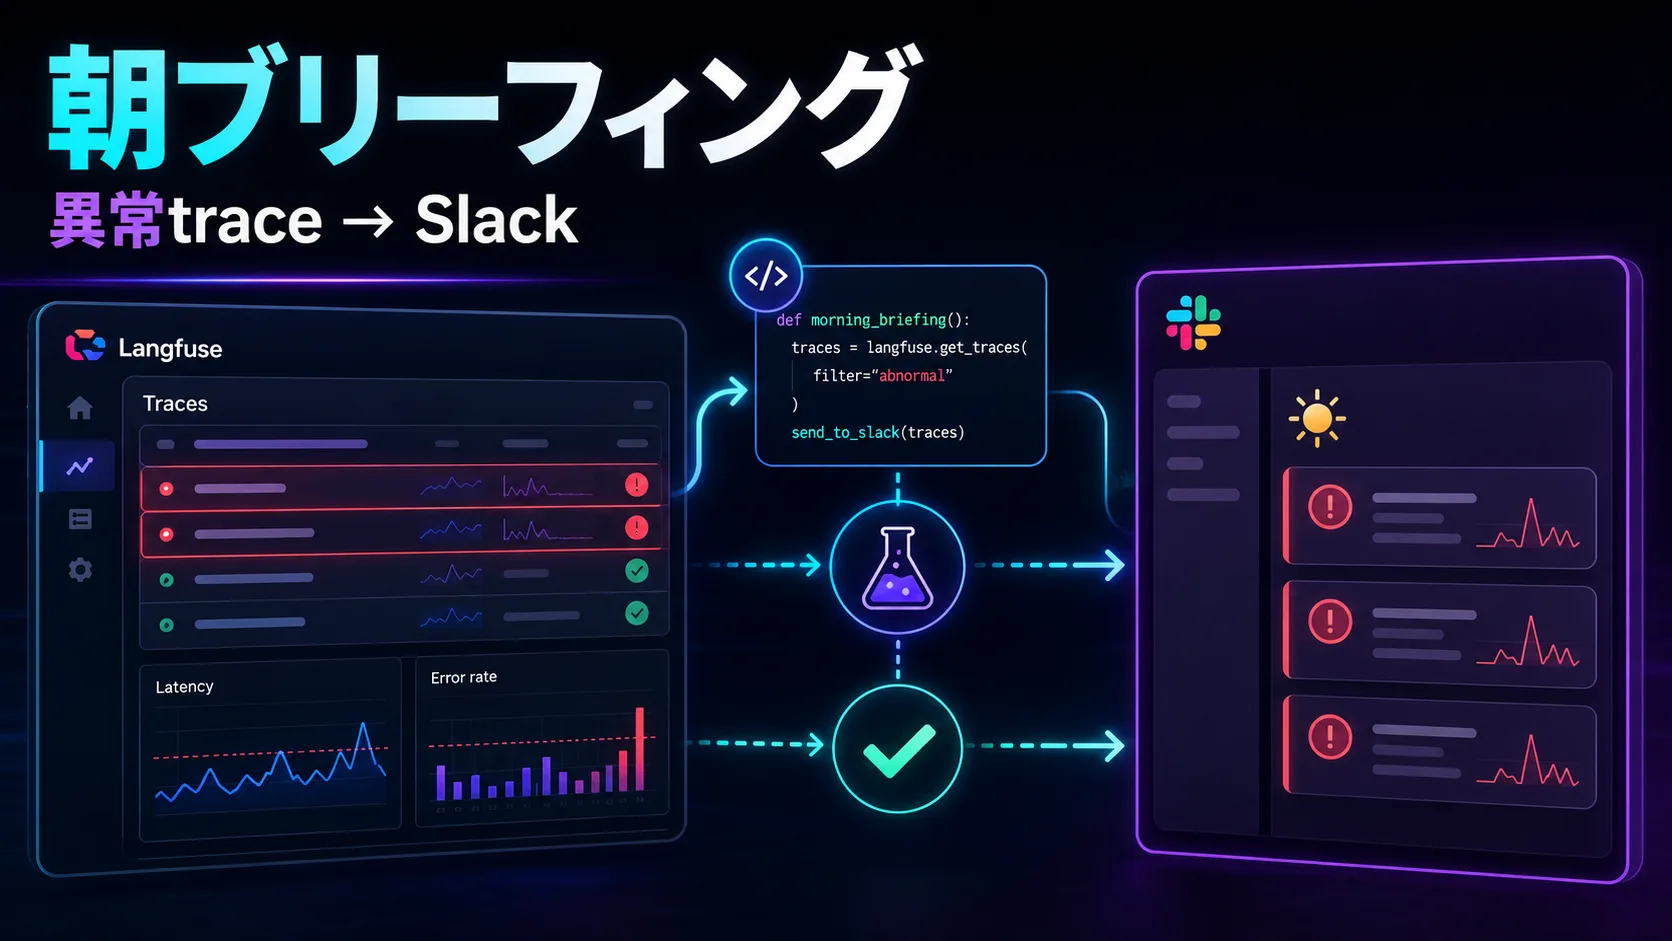
In previous posts, I built a “morning briefing” that aggregates Langfuse traces every morning via a Cloudflare Workers Cron and sends only the anomalies worth investigating to Slack.
- Concept: Sending only Langfuse anomalies to Slack as a morning briefing
- Implementation: Building and testing a Langfuse morning briefing: can it send only abnormal traces to Slack?
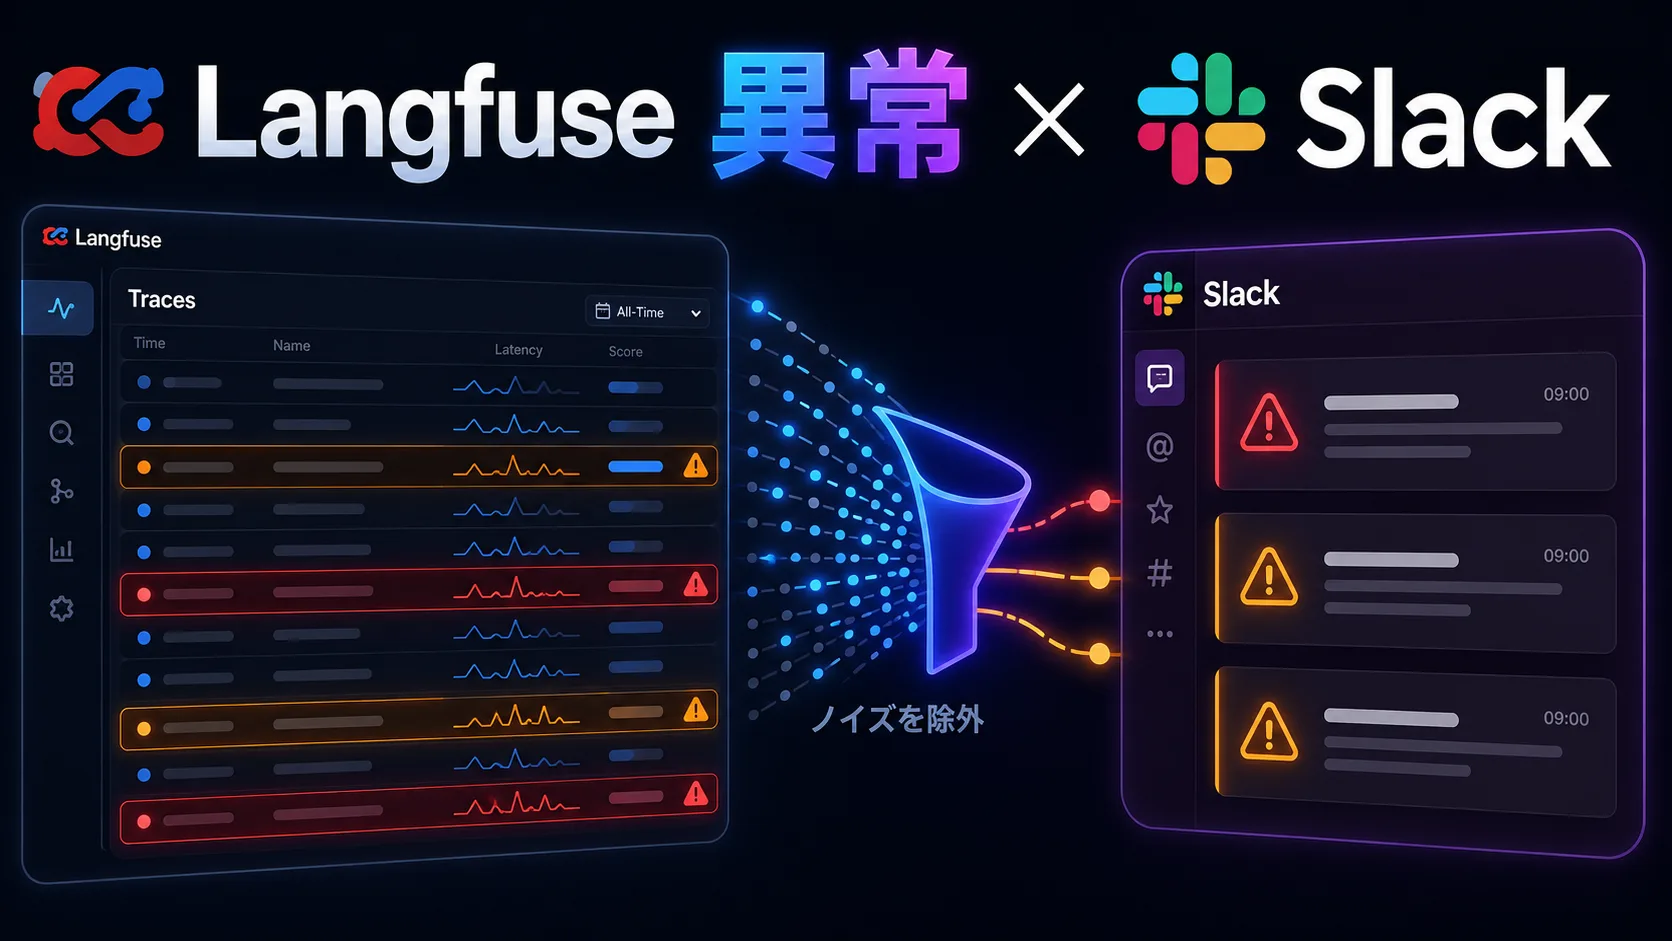
Recently, however, Langfuse released Monitors, a metrics monitoring feature. This post is not a feature introduction. Instead, I compare Monitors with my custom morning briefing worker to decide what belongs where. The short version is: threshold-based monitoring of cost and latency is probably better handled by Monitors. On the other hand, summarizing yesterday’s notable traces, lining up trace URLs as investigation entry points, and reading multiple conditions together each morning still leaves room for a custom worker.
First, the morning briefing worker worked
Here is what my custom implementation proved.
It successfully called the Langfuse API from a Cloudflare Workers Cron, aggregated the previous day in JST, and posted to Slack. After a Cron run, Slack received a notification like this:
Langfuse Morning Briefing

対象日: 2026-06-14
対象範囲: 2026-06-13T15:00:00.000Z - 2026-06-14T15:00:00.000Z
traces: 8
errors: 0
total tokens: 440,000
estimated cost: $0.1560

見るべき異常:
1. sample-morning-briefing-token-spike - tokens 55,000, latency 12.3s
   https://jp.cloud.langfuse.com/project/***redacted***/traces/***redacted***
...

取れなかった項目: score
Two things became clear from this result.
First, by traversing from traces to observations via the Langfuse API, I could retrieve token, cost, and latency at a granularity usable in a Slack notification. At first I only looked at the trace list, so tokens were missing. But by fetching trace details to get observation IDs and then calling the observation details API, I obtained usageDetails and costDetails.
Second, while the custom implementation is well suited for “reading yesterday’s anomaly candidates in one place,” it is slightly too heavy a responsibility for ongoing metrics-threshold monitoring. For example, if I only want to know when the total cost over the past hour exceeds a certain amount, a monitoring feature with an evaluation window is more natural than a worker that aggregates everything every morning.
What Langfuse Monitors is
Langfuse Monitors lets you set conditions on metrics inside Langfuse and send notifications to Slack, Webhooks, GitHub Dispatch, and more when thresholds are crossed. At the time of writing, I can see it as a beta feature on Langfuse Cloud.
My understanding is that Monitors plays the following role:
Langfuse Observations / Scores
  ↓
Aggregate metrics in the specified evaluation window
  ↓
Compare against WARNING / ALERT thresholds
  ↓
Send to Automations destinations
What matters here is that Monitors is visible as a “periodic metrics evaluation” feature, not a “read individual traces” feature. My morning briefing worker starts from traces and lines up “executions worth investigating from yesterday.” Monitors, in contrast, starts from Observations and Scores and asks, “Are the metrics crossing a threshold right now?”
Mixing these two roles leads to configuration friction. I actually ran into cases where Monitors did not react to traces I had seeded with npm run seed:langfuse.
Differences between my custom worker and Monitors
Although both send Slack notifications, the custom worker and Monitors excel at different things.
| Perspective | Custom morning briefing worker | Langfuse Monitors |
|---|---|---|
| Main purpose | Summarize previous day’s anomaly candidates for reading | Detect threshold crossings in a specified evaluation window |
| Starting point | Trace list, trace details, observation details | Metrics such as Observations / Scores |
| Notification timing | When Cron runs. In my case, every morning | Depends on the monitor’s evaluation interval |
| Notification content | Easy to list trace URLs and reasons for anomalies | Suited for metric values and state-change notifications |
| Aggregating multiple conditions | Can be implemented freely | Tends to assume one condition per monitor |
| Operational load | Requires handling API changes, pagination, secrets, and worker maintenance | Can be delegated to the official feature |
Looking at this table, the division of labor is fairly clear.
- Cost spikes, latency degradation, and traffic drops belong in Monitors.
- Morning summaries of the previous day, lists of trace URLs, and summaries of multiple anomalies stay in the worker.
- Score monitoring should be deferred until scores are being submitted reliably; only then decide whether Monitors or the worker is more appropriate.
In other words, Monitors did not make the worker completely unnecessary. However, the worker no longer needs to carry the burden of being the monitoring infrastructure itself.
What to check when a monitor does not react to seed traces
This was the most practical blocker I hit.
npm run seed:langfuse sends three types of events to the Langfuse ingestion API:
trace-create
generation-create
score-create
When a Monitor’s View is set to Observations, the monitoring target is the generation’s observation side, not the trace. Therefore, if “the trace is visible on the screen but the monitor does not react,” the first thing to suspect is not the Slack integration but the monitor’s target View, aggregation window, filters, and thresholds.
In this seed, the generation is created as an observation, and the observation details API returned the following values:
{
  "type": "GENERATION",
  "usageDetails": {
    "input": 30000,
    "output": 25000,
    "total": 55000
  },
  "costDetails": {
    "input": 0.0045,
    "output": 0.015,
    "total": 0.0195
  },
  "latency": 12.3
}
So for a Monitor looking at Total Cost or latency of Observations, the seed should theoretically be in scope. If it still does not react, check the following in order.
1. Is the evaluation window correct?
Monitors aggregates the period specified by “Over the past.” If you are looking at Over the past: 5m immediately after seeding, the trace will fall out of scope after five minutes. Conversely, the morning Cron notification targets 00:00 to 24:00 of the previous day in JST, so the same trace is viewed through a different time window.
Start by widening the window to something like Over the past: 1h or 1d so the seed trace is definitely included.
2. Do Measure and Aggregation match?
The seed cost is costDetails.total = 0.0195. If you set an ALERT threshold of 50 USD for cost monitoring, it will obviously not trigger.
For testing, set a very low value:
View: Observations
Measure: Total Cost
Aggregation: Sum
Trigger: above or equal to
ALERT Threshold: 0.001
Over the past: 1h
With this condition, even a single seed should cross the threshold because 0.0195 exceeds it. If you seeded multiple times, the sum will be even larger.
3. Are filters dropping it?
If the Monitor has filters for environment, tag, name, or model, the seeded observation may be excluded.
In this seed, the trace carries tags: ["morning-briefing-test"] but the generation side does not explicitly carry the same tag. If the Observations View filter looks at observation-side attributes, it will not match even if you expect it to use the trace-side tag.
During testing, remove all filters first and watch for a reaction. After that, if needed, explicitly set metadata or name in the generation body and use attributes that the Monitor can filter on.
4. Are you misunderstanding no-data mode?
No-data mode controls how missing data in the evaluation window is handled. This is separate from cases where data exists but does not cross the threshold.
For example, if you set cost monitoring to Treat missing data as 0, but the seed observation is dropped by a filter, it may simply look like “treated as 0.” The lack of notification is not Slack’s fault; the monitor’s aggregation target may be empty.
5. Is the Automation destination linked to the Monitor?
Monitors reuses existing Automation destinations. Even if the Slack integration itself is correct, the monitor will not notify unless the target channel is checked in the Monitor’s Notifications.
This is easy to overlook. After saving once, reopen the Monitor details and confirm that the destination is still there.
The first three monitors to create
For my use case, the first three monitors are probably enough. If you start monitoring everything at once, the noise grows and you stop looking.
1. Cost spike
View: Observations
Measure: Total Cost
Aggregation: Sum
Over the past: 1h
Trigger: above or equal to
WARNING: operational attention line
ALERT: immediate review line
No data: Treat missing data as 0
Cost is the easiest metric to treat as “0 if no data.” This is the most natural fit for Monitors.
2. Latency degradation
View: Observations
Measure: Latency
Aggregation: Avg or equivalent to p95
Over the past: 30m
Trigger: above
No data: Keep the previous severity
Latency should not treat missing data as 0. During periods with no traffic, “0 seconds looks healthy” would be misleading. The no-data handling needs to differ from cost monitoring here.
3. Pipeline break
View: Observations
Measure: Count
Aggregation: Count
Over the past: 30m
Trigger: below
ALERT: 1
No data: Treat missing data as 0
For overnight batches or scheduled agents that should always produce observations within a certain interval, a count of zero is itself an anomaly. Here, treating no-data as 0 is natural.
The remaining problem is score
In the morning briefing worker, I got token, cost, and latency working. Score, however, is still not coming through cleanly.
The seed sends score-create, but the scores field in the trace details API response was empty. This does not mean the score was not submitted; it may simply not be included in the trace details response, or the endpoint and timing may differ.
Monitors has a View that targets Scores, so quality score monitoring may actually be more natural there. That said, this is still under verification. I will decide after confirming score naming, numeric versus categorical types, aggregation windows, and no-data handling.
Current conclusion
From this verification, I feel Langfuse monitoring is best split as follows:
Metric anomalies that need immediate awareness
  → Langfuse Monitors

Morning summaries of the previous day's activity
  → Custom morning briefing worker

Investigation lists of trace URLs
  → The custom worker is still convenient

Ongoing quality score monitoring
  → Candidate for Monitors, but requires verification of score submission and retrieval
The release of an official feature did not eliminate the value of my custom implementation; it simply clarified what the custom implementation should cover. Monitors is the “alarm” function; the custom worker is the “reading” function. This separation feels right so far.
Next, I will configure several Monitors and investigate why they do not react to seed traces from both the UI and the API. In particular, whether Observations filters look at trace-side tags or only observation-side attributes will likely become a significant operational concern.