Building a Langfuse Morning Briefing for Slack
A practical experiment that aggregates Langfuse traces in a Cloudflare Worker and sends only token, cost, and latency anomalies to Slack.
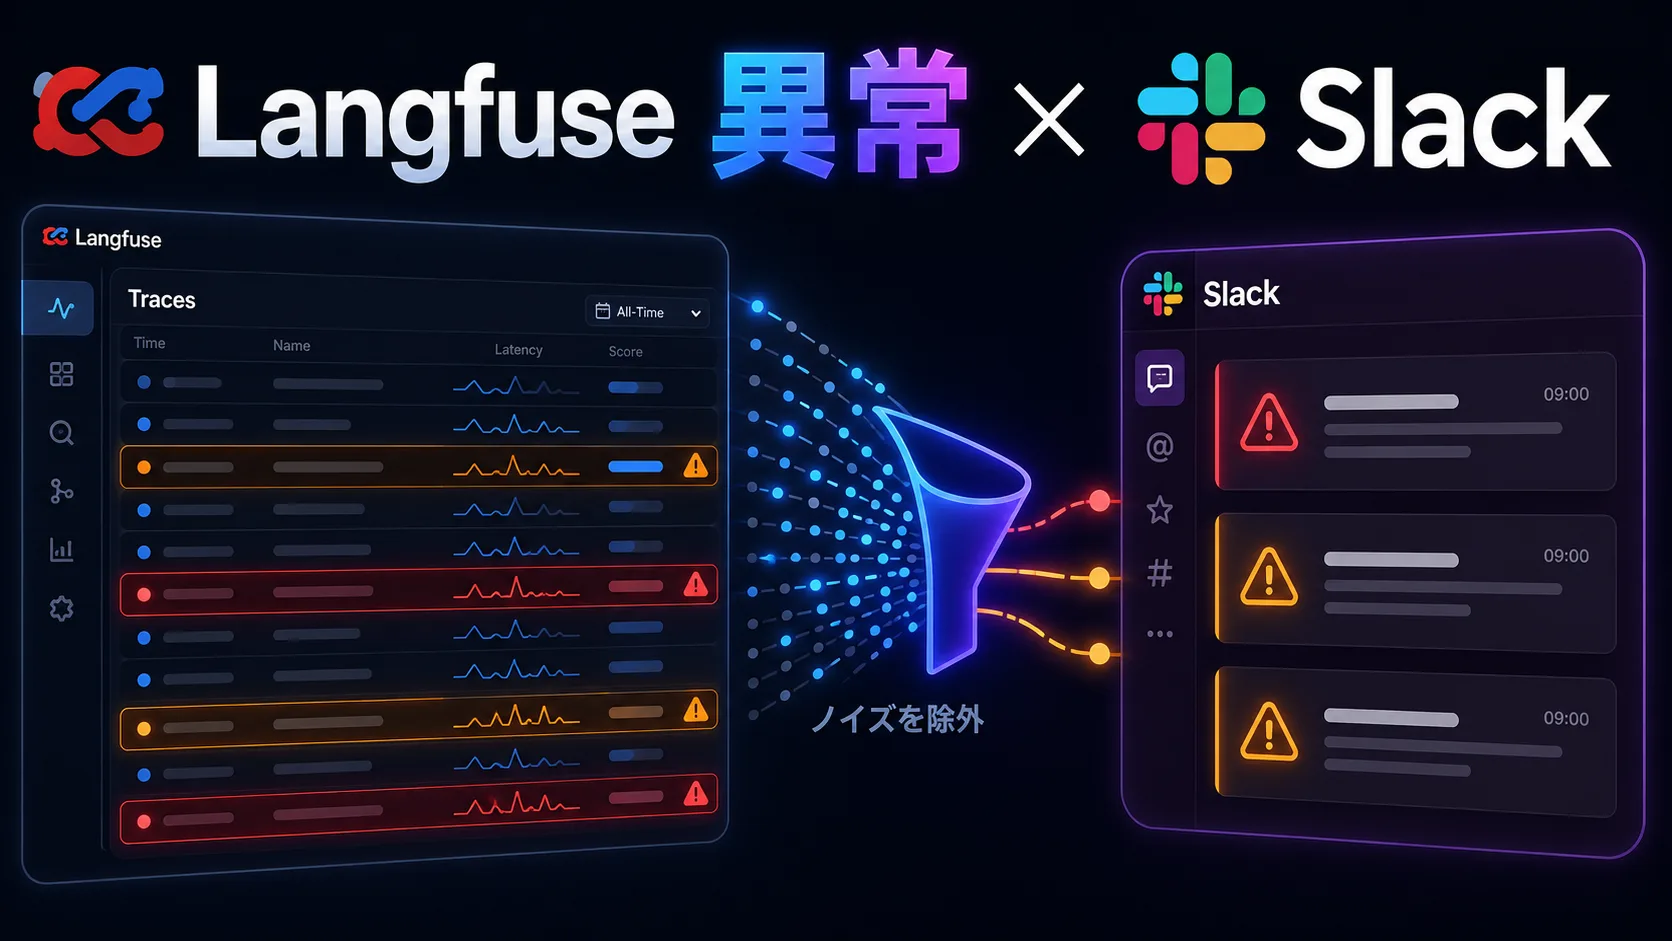
Opening Langfuse every morning to inspect traces is not a sustainable operating model. I wanted a small briefing that would summarize the previous day and send only the traces worth investigating to Slack.
The resulting implementation runs as a scheduled Cloudflare Worker. It reads Langfuse traces, enriches them with observation-level usage data, applies simple anomaly thresholds, and posts a compact report to Slack.
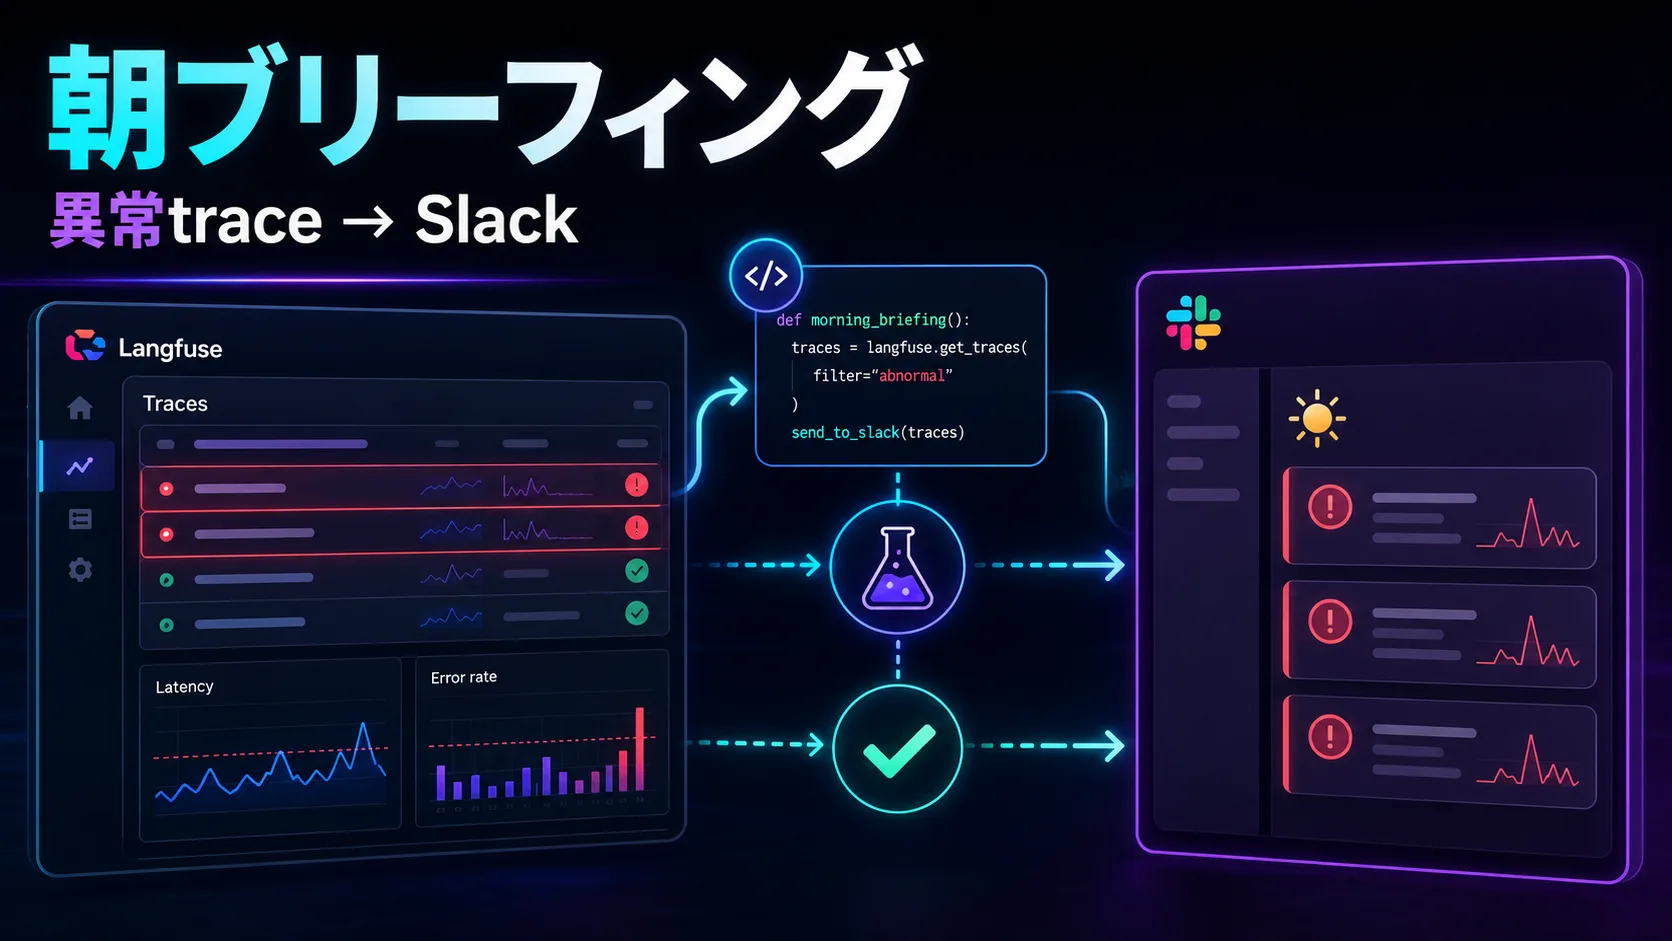
Architecture
Cloudflare Workers Cron
  ↓
Fetch traces from the Langfuse API
  ↓
Fetch trace and observation details
  ↓
Calculate token, cost, and latency anomalies
  ↓
Post the briefing to Slack
The first version deliberately avoids automatic remediation and issue creation. Its only job is to answer one question: did anything happen yesterday that deserves attention?
Initial anomaly rules
The experiment started with absolute thresholds because comparing with previous days would require persistent storage.
| Signal | Initial threshold |
|---|---|
| Errors | At least one |
| Total tokens | 50,000 or more |
| Cost | $1.00 or more |
| Latency | 10 seconds or more |
| Score | Below 0.5 |
What did not work as expected
Remote secrets were not available during local development
Secrets configured for the deployed Worker were not automatically available to wrangler dev. The local process returned a Langfuse 401 until the required values were added to .dev.vars.
A diagnostic endpoint helped confirm the base URL and whether each key existed without exposing the secret values themselves.
The trace list did not contain enough usage data
I initially expected the trace list endpoint to provide token, cost, latency, and score data. In practice, generation usage was not always available there.
The implementation had to retrieve data in three stages:
/api/public/traces
  ↓
/api/public/traces/{traceId}
  ↓
/api/public/observations/{observationId}
Observation details finally exposed the values needed for the briefing:
{
  "type": "GENERATION",
  "usageDetails": {
    "input": 30000,
    "output": 25000,
    "total": 55000
  },
  "costDetails": {
    "total": 0.0195
  },
  "latency": 12.3
}
Time zones made manual testing misleading
The Worker selects a calendar day in JST, while Langfuse timestamps and Cron schedules use UTC. A trace created at 22:10 UTC belongs to the following morning in Japan. Manual tests using the wrong daysAgo value therefore returned zero traces even though ingestion had succeeded.
The Slack message now includes the exact UTC range so this error is visible immediately.
Result
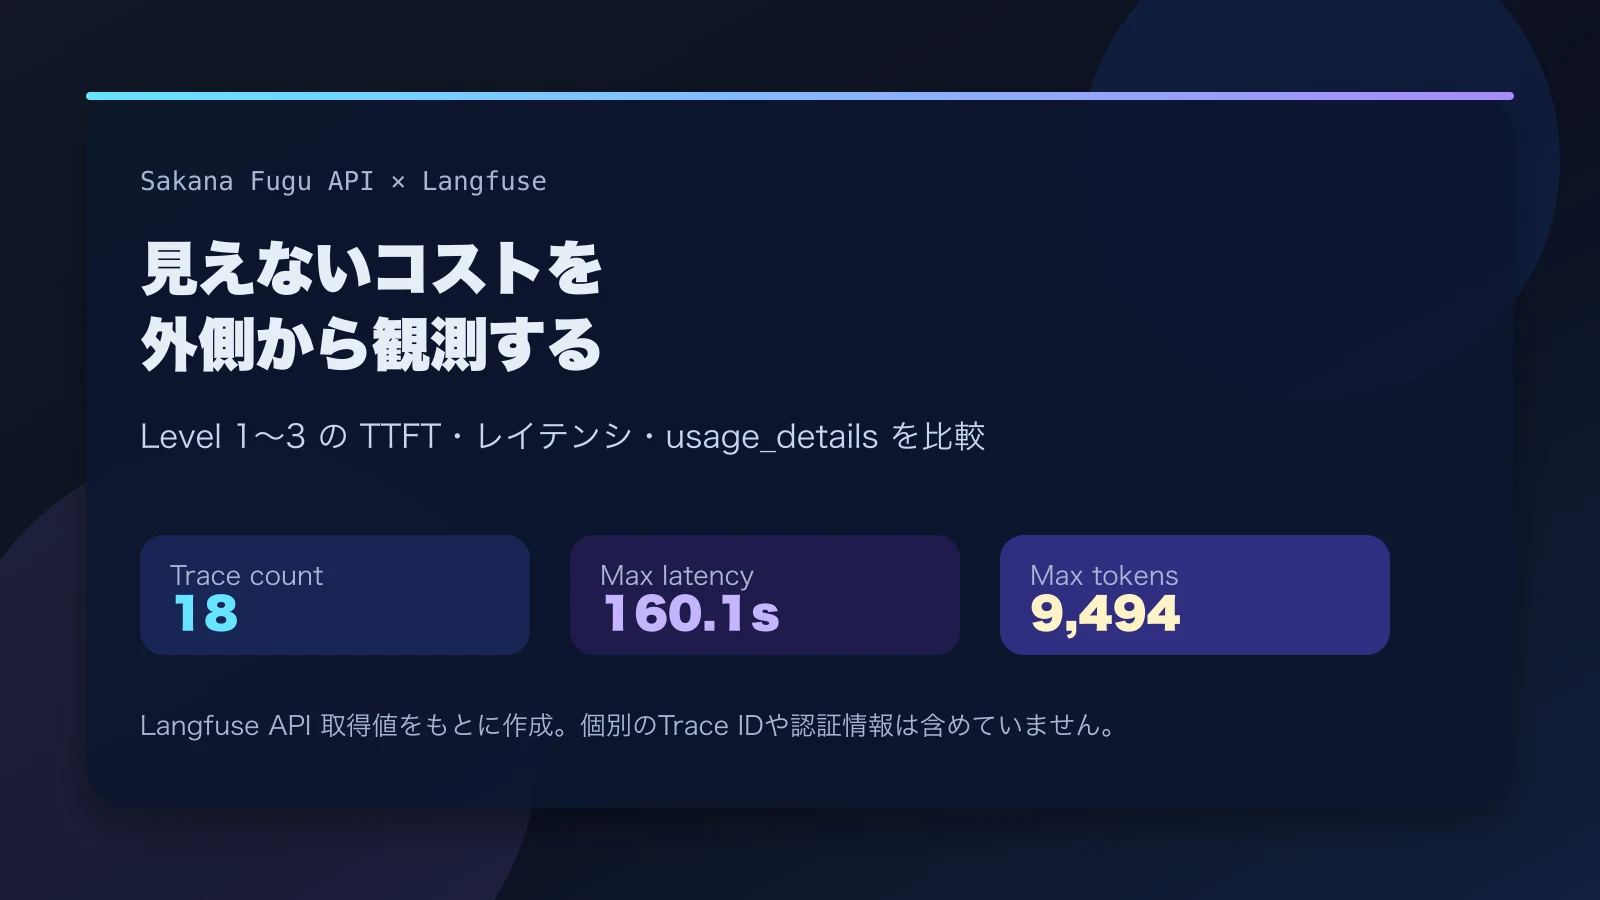
The scheduled Worker successfully sent a briefing containing the trace count, total tokens, estimated cost, and the highest-priority anomalies. Synthetic traces with 55,000 tokens and 12.3 seconds of latency were correctly highlighted.
This was enough to validate the operating model: instead of browsing every trace, I can start from a short list of abnormal executions.
Remaining limitations
- Score retrieval still needs a reliable API path.
- Repeated synthetic traces should be grouped or deduplicated.
- Thresholds should eventually be configurable per agent or workflow.
- Previous-day comparisons require storage such as KV or D1.
- Slack formatting should prioritize the most important reason for each anomaly.
The next useful step is not more automation. It is improving the signal quality until the morning briefing consistently points to traces that are genuinely worth opening.