Streaming Flue Observe Events to Langfuse: Monitoring an Issue Triage Agent
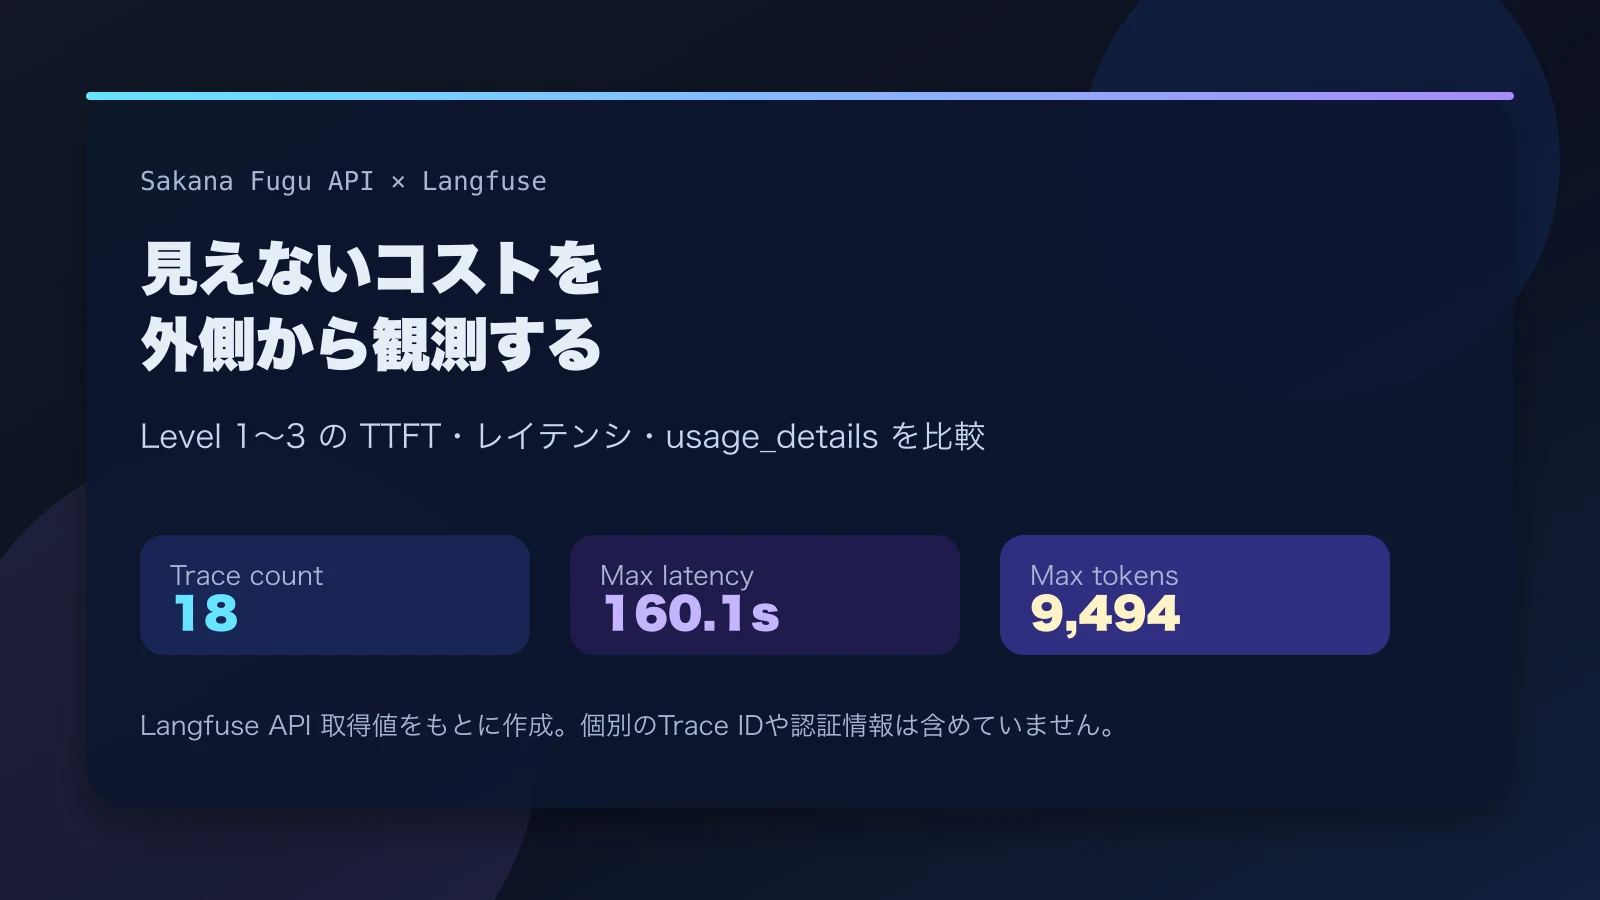
An experiment log where I redact Flue 1.0 Beta observe events before sending them to Langfuse, tracking the issue triage workflow's runId, model, and results.
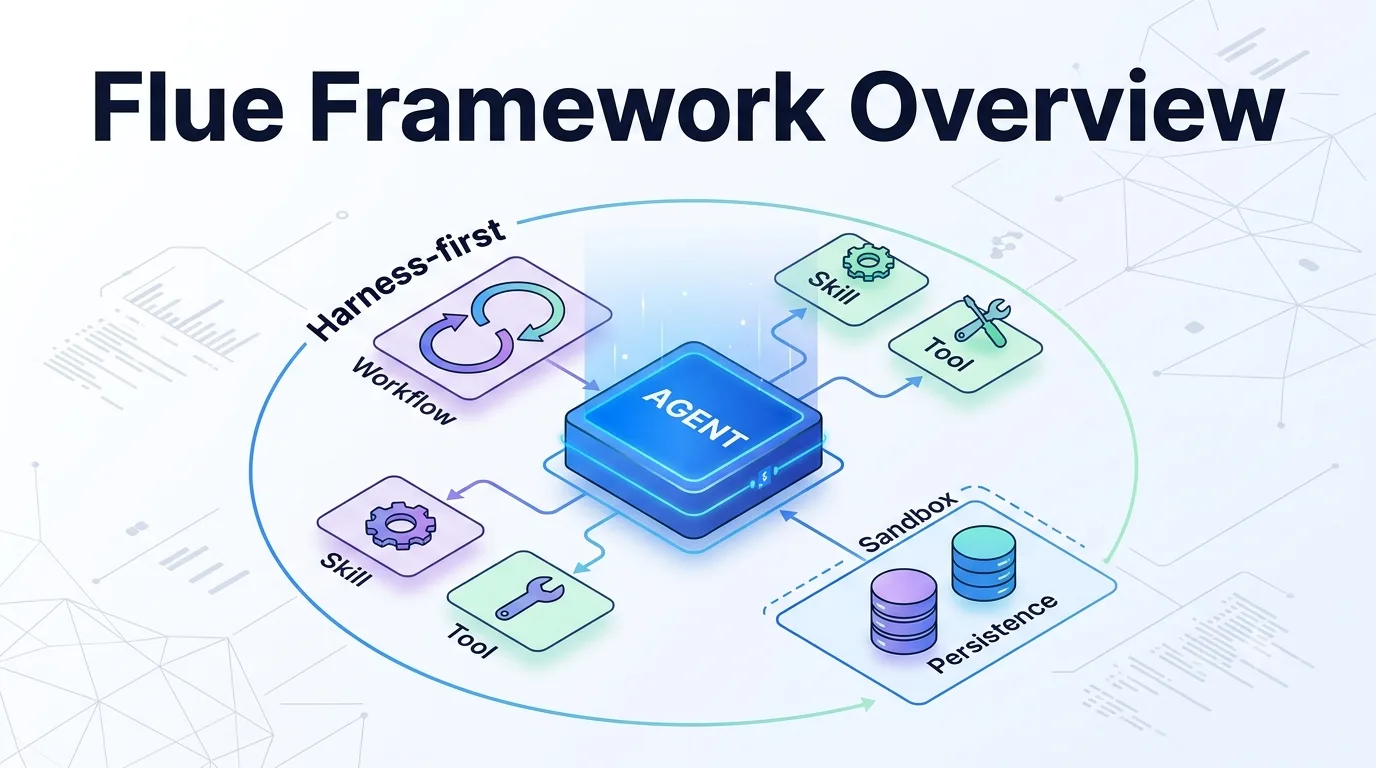
In the previous post, I built an issue triage agent with Flue 1.0 Beta that takes a GitHub issue title and body, then returns severity, reproducibility, label candidates, and a summary.
つれづれなる Agent OPS Trying Out a GitHub Issue Triage Agent with Flue 1.0 Beta An experiment log where I used Flue 1.0 Beta's agent, skill, and workflow features to build a triage agent that returns structured severity, reproducibility, and label candidates from GitHub issues. https://llm-lab.dev/posts/flue-1-0-beta-issue-triage-agent/
I also tried calling the same workflow from GitHub Actions in a separate article.
つれづれなる Agent OPS Calling Flue Workflows from GitHub Actions: Moving Issue Triage to CI An experiment log where I dry-ran a Flue workflow from a GitHub issue creation event to verify boundaries on CI before building a persistent server. https://llm-lab.dev/posts/flue-github-actions-issue-triage-workflow/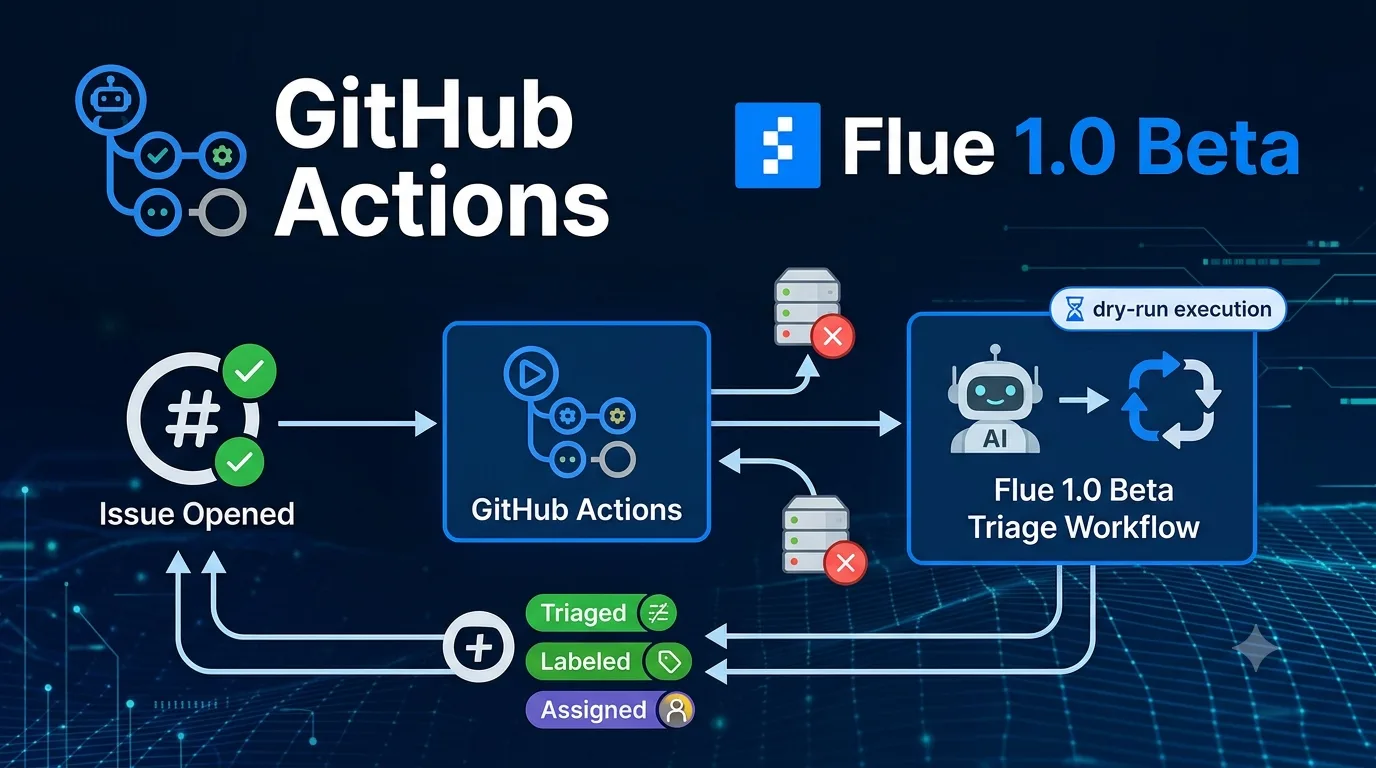
This time, I continue from there by capturing Flue’s observe(...) execution events and sending them to Langfuse after redacting the issue body.
What I want to do is not simply “send logs to an external service.” If I am going to operate an issue triage agent, I need to be able to answer the following questions later:
- For which issue input did which workflow run execute?
- Which model completed the structured output?
- What was the difference between cases that failed at
finishand those that succeeded? - What should I save and what should I not save for later evaluation and improvement?
Flue’s observe(...) is the entry point for in-app events that lets me track these. At the granularity of run_start, turn_request, operation, and run_end, I can capture workflow inputs, model calls, structured output, and usage.
However, events from observe(...) include the workflow payload and model inputs. Since issue bodies may contain internal URLs and email addresses, I reselect only the items I want to compare later before sending to Langfuse. This time, instead of the full body, I decided to send a redacted bodyPreview, character count, runId, model, success/failure, and triage results.
Adding an Observability Layer to the Issue Triage Workflow
In this experiment, I kept the structure of the previously built issue triage workflow largely unchanged and only added a thin layer for observability. The key points are at what granularity Flue execution events are captured and where redaction happens before sending to Langfuse.
The main files I added are as follows:
src/
├─ observability/
│  ├─ langfuse-adapter.ts  # Converts FlueEvent to Langfuse payload
│  ├─ redact.ts            # Masks URLs, emails, and key-like strings in issue bodies
│  └─ register.ts          # Registers observe(...)
├─ app.ts                  # Imports observability/register
└─ workflows/
   └─ triage-issue.ts      # Adds safe issue summary to log.info
Registering observe in app.ts
According to Flue’s documentation, observe(...) is registered at the application entrypoint. In this experiment, I imported the observability registration file before routing flue() in src/app.ts.
import './providers';
import './observability/register';
import { flue } from '@flue/runtime/routing';
import { Hono } from 'hono';

const app = new Hono();

app.get('/health', (c) =>
	c.json({
		ok: true,
		model: process.env.FLUE_MODEL ?? 'sakura/gpt-oss-120b',
	}),
);

app.route('/', flue());

export default app;
In register.ts, if FLUE_OBSERVE_JSONL is specified, raw events are saved to JSONL, and simultaneously converted to a Langfuse payload and sent.
import { observe } from '@flue/runtime';
import { sendToLangfuse, toLangfuseEnvelope, writeJsonl } from './langfuse-adapter';

const observeJsonl = process.env.FLUE_OBSERVE_JSONL;

if (observeJsonl || process.env.FLUE_LANGFUSE_DRY_RUN || process.env.LANGFUSE_PUBLIC_KEY) {
	observe((event) => {
		if (observeJsonl) {
			writeJsonl(observeJsonl, event);
		}

		const envelope = toLangfuseEnvelope(event);
		if (!envelope) return;

		void sendToLangfuse(envelope).catch((error) => {
			console.warn('[observability] failed to export event', event.type, error);
		});
	});
}
The important thing here is that I separated raw events from external-send payloads. Raw events are useful for checking Flue’s behavior, but should not be sent to external services as-is. This time, whether in dry-run or actual sending, I leave the external-send payload in logs/langfuse-payloads.jsonl, and npm run triage:langfuse throws the same payload to Langfuse.
Deciding What to Send to Langfuse First
The first thing I decided was to correlate Flue’s runId with Langfuse’s trace. In issue triage, I might re-run the same input with different models, or review only failure cases later. If Flue’s run_... and Langfuse’s trace do not correspond, CLI logs, app logs, and the Langfuse interface become separate records.
In this adapter, I created the traceId from run_....
const runId = event.runId ?? event.instanceId ?? 'no-run-id';
const traceId = `flue-${runId}`;
For target events, I temporarily narrowed it down to the following:
if (!['run_start', 'run_end', 'operation', 'turn_request', 'turn', 'log'].includes(event.type)) {
	return null;
}
Sending everything including message_start, message_end, and thinking_delta increases the information volume, but also makes it easier to include issue body text and intermediate reasoning content. This time, I focused on “units I want to compare later” and decided to look only at run, operation, turn, and log.
With this narrowing, what I mainly want to see is the following correspondence:
| What I want to see | Flue event | What I want in Langfuse |
|---|---|---|
| Workflow start | run_start | Trace start, redacted input summary |
| Model call | turn_request, turn | Model, provider, input summary, success/failure |
| Structured output | operation | Triage result, usage, duration |
| Workflow end | run_end | Final result, status |
Do Not Send Issue Bodies as-Is
For the test payload, I deliberately mixed in internal URLs and email addresses.
For execution verification, I prepared an npm script so that the same sample issue can be repeatedly passed to the workflow. This is not a standard Flue command; internally it calls flue run triage-issue --target node --payload ....
To check only the payload in dry-run, run the following:
npm run triage:observeTo actually send to Langfuse, add LANGFUSE_PUBLIC_KEY, LANGFUSE_SECRET_KEY, and LANGFUSE_BASE_URL to .env, then run this:
npm run triage:langfuseIf you want to verify the same thing with the standard CLI alone, pass the same JSON payload to flue run triage-issue --target node --payload ... instead of the above script.
When executed, a run ID appears on the Flue side.
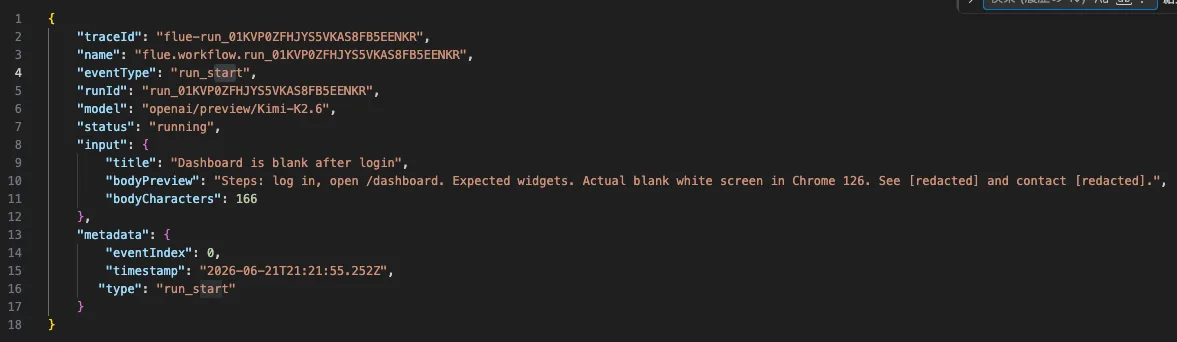
run run_01KVNW45DM0EGDHVA92D86V935The beginning of the payload sent to Langfuse looks like this:
{
  "traceId": "flue-run_01KVNW45DM0EGDHVA92D86V935",
  "eventType": "run_start",
  "runId": "run_01KVNW45DM0EGDHVA92D86V935",
  "model": "openai/preview/Kimi-K2.6",
  "status": "running",
  "input": {
    "title": "Dashboard is blank after login",
    "bodyPreview": "Steps: log in, open /dashboard. Expected widgets. Actual blank white screen in Chrome 126. See [redacted] and contact [redacted].",
    "bodyCharacters": 166
  }
}
Here, instead of the body itself, I send only the redacted bodyPreview and character count. Even at this granularity, I can track which issue input corresponds to which runId.
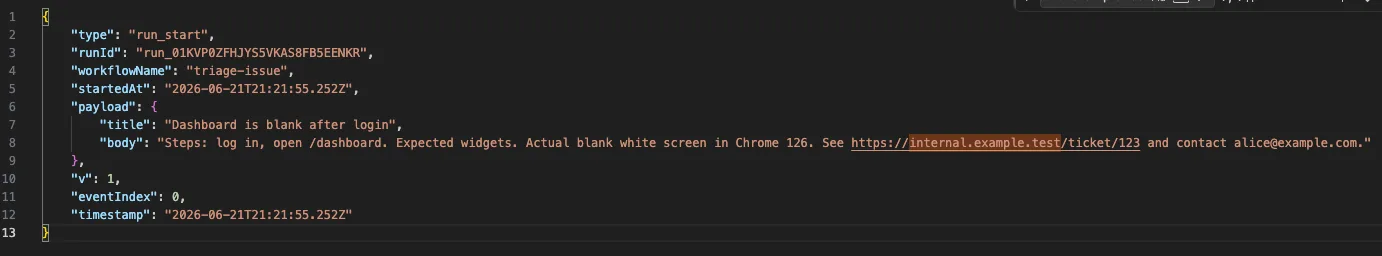
Raw Observe Logs Retain Original Data
On the other hand, raw events saved with FLUE_OBSERVE_JSONL=logs/flue-observe-events.jsonl contain the original issue body. This is not because Flue is bad, but because observe(...) is a mechanism to see in-app execution events as-is.
For example, run_start contains the workflow payload as-is.
{
  "type": "run_start",
  "runId": "run_01KVNW45DM0EGDHVA92D86V935",
  "workflowName": "triage-issue",
  "payload": {
    "title": "Dashboard is blank after login",
    "body": "Steps: ... See https://internal.example.test/ticket/123 and contact [email protected]."
  }
}
Furthermore, turn_request and message_end contain the input text passed to the model. In other words, even if external-send redaction is applied, sensitive information may remain in the raw event local storage destination.
The lesson from this experiment is simple: observability logs are not “convenient records to look back at,” but copies of input data. When handling issue bodies, you need to decide the raw log storage destination, retention period, and git exclusion policy.
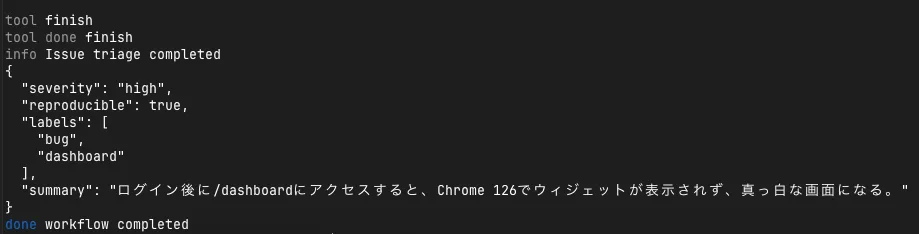
Success Cases Are Trackable via operation and run_end
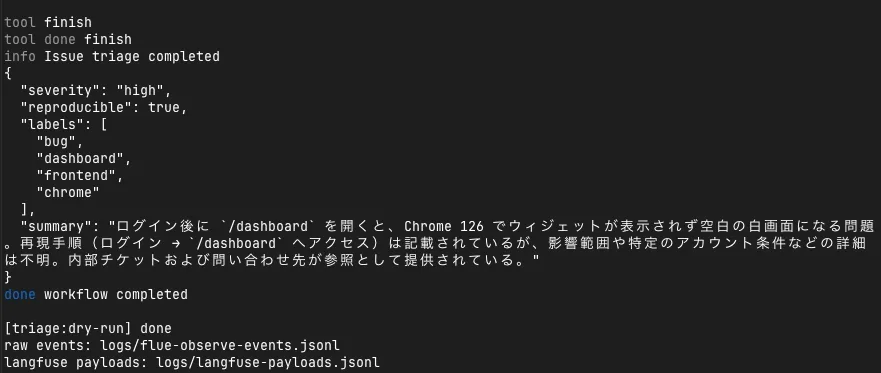
In this success case, the operation event contained structured output and usage.
{
"eventType": "operation",
"runId": "run_01KVNW45DM0EGDHVA92D86V935",
"status": "success",
"output": {
"data": {
"severity": "high",
"reproducible": true,
"labels": ["bug", "dashboard", "frontend"],
"summary": "ログイン後に `/dashboard` を開くと..."
},
"usage": {
"input": 258,
"output": 958,
"cacheRead": 2368,
"totalTokens": 3584
}
}
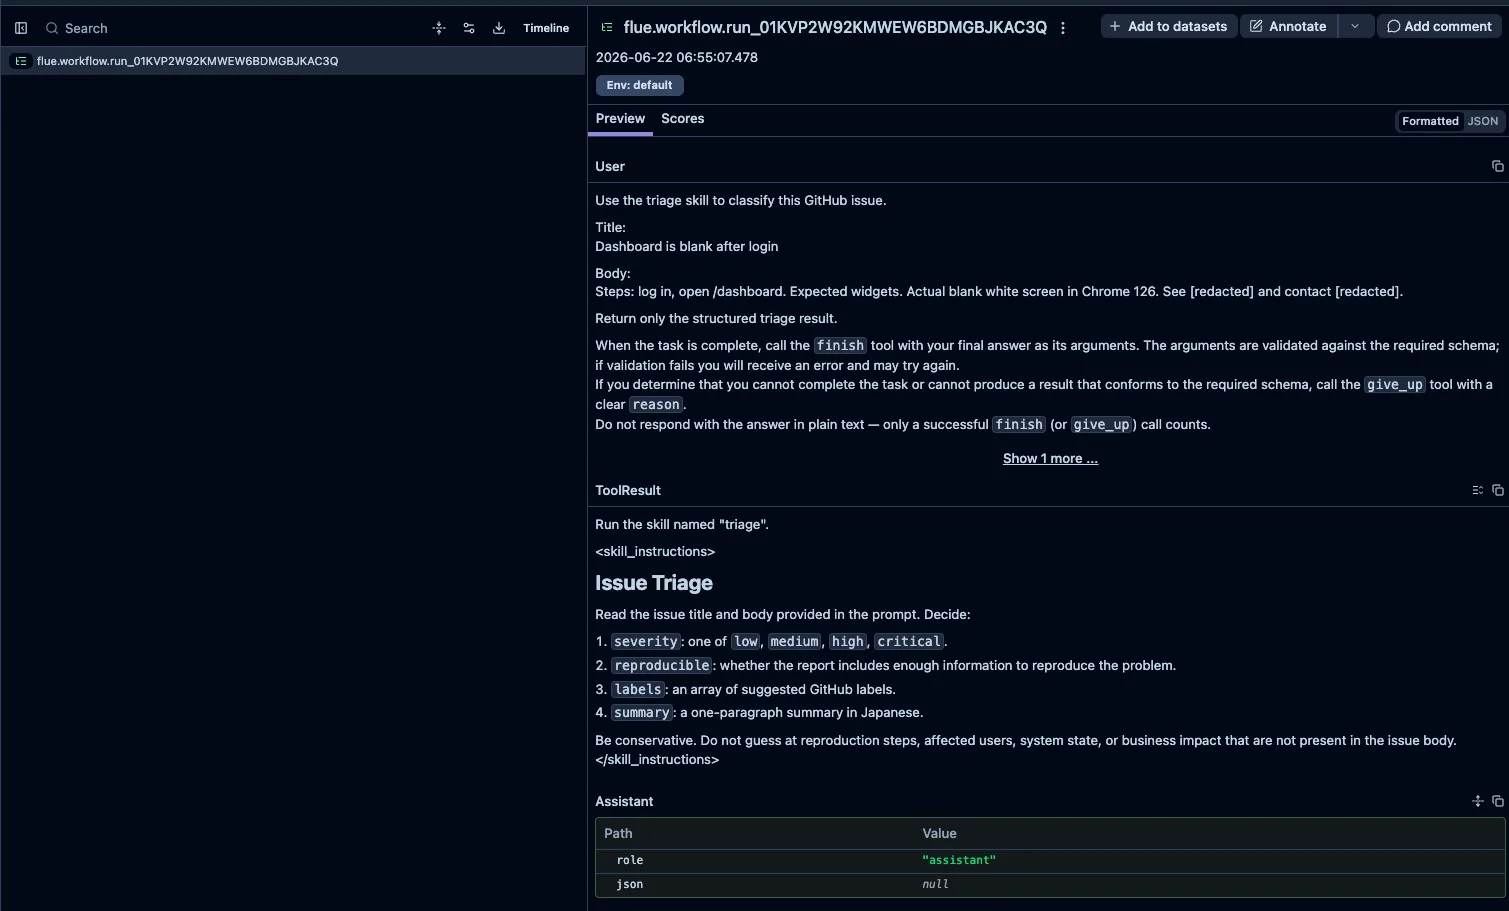
}The final result also remains in run_end. On the Langfuse side, if I arrange run_start, turn_request, operation, and run_end within the same traceId, I can review the input summary, model, usage, and final result later.
Looking at it on Langfuse, the trace aggregates the model name, event type, and triage result. Unlike temporary terminal logs, I can later confirm on screen “which model was used in this run and what structured output was returned.”
Sending to Langfuse for Real
npm run triage:langfuse runs the same workflow with FLUE_LANGFUSE_DRY_RUN=0 instead of dry-run. When the send succeeds, the terminal shows logs like this:
[langfuse] ingested run_start flue-run_...
[langfuse] ingested operation flue-run_...
[langfuse] ingested run_end flue-run_...
If it fails, I made it output [langfuse] ingestion failed with the HTTP status and response body. When this appears, I suspect the Langfuse API key, base URL, or ingestion payload format.
Tracking Failures That Do Not Reach finish
Another thing I wanted to see was not just success cases. In the previous issue triage experiment, some models failed to reach Flue’s expected finish tool call, causing the agent to repeat similar reasoning.
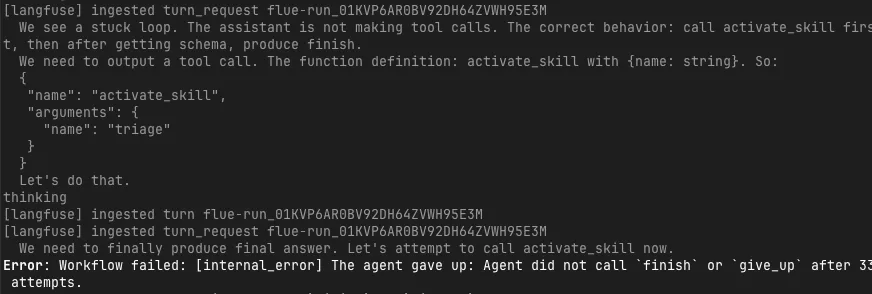
In this failure case too, turn_request and turn continued to be sent to Langfuse, but the workflow eventually stopped with the following error:
Workflow failed
The agent gave up: Agent did not call `finish` or `give_up` after 33 attempts.
The important thing here is that the model was not “doing nothing.” Looking at the trace, the model repeatedly mentioned activate_skill and finish, but could not reach the tool call required by Flue’s execution protocol. It says plausible things in natural language, but cannot satisfy the agent framework’s completion condition. This is a difference that is easy to miss with a single error log alone.
Not a Choice Between Flue Alone or Langfuse
After working through this, I can see that Flue’s observe(...) alone reveals quite a bit. RunId, event type, operation, turn, usage, and structured output are all captured on the Flue side.
However, when I want to compare failure cases later as part of LLMOps, there is value in putting them on an external observability platform. For example, if I feed the same issue payload to gpt-oss and another model, and one fails at finish while the other completes the structured output, it is easier to track where it broke when arranged as traces rather than reading isolated logs.
So it is neither “external observability is unnecessary because Flue shows everything by default” nor “Flue’s observe is unnecessary because Langfuse is used.” Flue’s observe(...) is the foundation for seeing execution events, and Langfuse is the place to load failure cases into a comparison, evaluation, and improvement cycle. This division of roles seems suitable for practical agents like an issue triage agent.