---
title: "Long-Term Analysis of Langfuse LLM Traces with ClickHouse"
description: "A verification log on normalizing Langfuse Observations and Scores into ClickHouse, then using SQL to inspect model-level cost, prompt-version quality trends, and retry-driven cost increases."
lang: "en"
canonical: "https://llm-lab.dev/en/posts/langfuse-clickhouse-trace-analytics/"
source: "https://llm-lab.dev/en/posts/langfuse-clickhouse-trace-analytics.md"
publishedAt: "2026-07-07"
updatedAt: "2026-07-07"
category: "Clickhouse"
tags:
- "clickhouse"
- "langfuse"
- "llmops"
- "observability"
- "agentops"
---
# Long-Term Analysis of Langfuse LLM Traces with ClickHouse
import LinkCard from "../../components/LinkCard.astro";
Once you start storing traces in Langfuse, the UI is already very useful at first. You can see which prompt was sent, which model responded, token usage, cost, latency, and Scores lined up by trace. For investigating one failed run, that is enough.
But once traces accumulate, a different problem appears.
> I want to look across 30 days. I also want to see quality changes by prompt version. I want to separate whether cost is rising because of retries or because of model pricing.
Right. This is no longer a matter of opening individual traces one by one.
I do not want to stop using Langfuse and build an analytics platform from scratch. It is the opposite. It felt more natural operationally to keep Langfuse as the primary place for observation, and move only long-term, cross-sectional analysis into ClickHouse.
This time, I normalized a fixture shaped like Langfuse Observation API data into ClickHouse, then used SQL to inspect model-level cost, quality trends by prompt version, retry-driven cost increases, and outlier candidates. The fixture was created for this public article. It is not real customer data or production trace data. The point is not the trend in the data itself, but the design of turning Langfuse observation data into a shape that ClickHouse can read.
## Separating the Roles of Langfuse and ClickHouse
Langfuse's [Observability Overview](https://langfuse.com/docs/observability/overview) explains the idea of tracing LLM application requests, prompts, responses, token usage, latency, tools, and retrieval processing as traces. Its [Evaluation Overview](https://langfuse.com/docs/evaluation/overview) also organizes the workflow for evaluation using live traces, datasets, experiments, and Scores.
That scope is where Langfuse is strong. Open one failed trace, inspect the input, output, Observations, and Scores, and follow the cause. Or look at the basis for an evaluation Score and annotate it as a human. This is not the place I want ClickHouse to replace.
On the other hand, Langfuse's [API and Data Platform](https://langfuse.com/docs/api-and-data-platform/overview) also assumes connections to external workflows and data warehouses. If you want row-level spans, generations, and events, there is the [Observations API v2](https://langfuse.com/docs/api-and-data-platform/features/observations-api). If you want aggregated cost, usage, latency, and scores, there is the [Metrics API v2](https://langfuse.com/docs/metrics/features/metrics-api). If you want to export large volumes of data periodically, [Blob Storage Export](https://langfuse.com/docs/api-and-data-platform/features/export-to-blob-storage) is another option.
For this verification, I separated the roles like this.
| Purpose | Place to Use |
|---|---|
| Read one trace | Langfuse UI |
| Inspect the basis for a Score | Langfuse UI |
| Get recent aggregates through an API | Langfuse Metrics API |
| Retain data long-term or join it with internal data | ClickHouse |
| Extract outlier candidates and return to individual traces | Return from ClickHouse to Langfuse by `trace_id` |
The reason to add ClickHouse is not to thin out Langfuse. The primary trace information stays in Langfuse. ClickHouse is used to narrow down which traces deserve attention. With that framing, the division of responsibility becomes much cleaner.
## What I Built for the Verification
For the verification, I prepared a fixture close to the response shape of Langfuse Observations API v2. It contains 10 Generation Observations and 20 Scores. The subject is a Hermes Agent-like pricing decision trace, but the fixture was made for public use, so it does not include prompt text, completion text, user input, or business-specific information.
The verification script is custom-made. It is neither a Langfuse official CLI nor a ClickHouse official CLI. The input is the fixture JSON. The outputs are JSONEachRow files for ClickHouse ingestion, DDL, SQL, and an HTML report. When connecting to ClickHouse running in Docker, the same JSONEachRow data is inserted through the HTTP API, and the SQL is executed.
```bash
npm run clickhouse:up
npm run verify:clickhouse
npm run clickhouse:down
```
`verify:clickhouse` checks five things.
1. Observation rows and Score rows can be inserted into ClickHouse.
2. Observations and Scores can be joined by `trace_id`.
3. Cost, tokens, latency, quality, and success rate can be aggregated by model.
4. Daily trends can be inspected by prompt version.
5. Outlier candidates can be extracted from cost, quality, and retry attempts.
The quietly annoying point during verification was the default user in the ClickHouse Docker image. At first, because this was only a verification environment, I thought an empty password would be fine and started it with an empty `CLICKHOUSE_PASSWORD`. In the entrypoint, however, that was treated as unset, and network access for the default user was disabled. The HTTP API returned 401, stopping the work before SQL was even relevant.
> Wait, we are starting there?
In the end, I explicitly set a fixed verification password and passed both user and password in the HTTP API URL. This is not the main subject of ClickHouse analysis itself, but it matters a lot for an article reproduction environment. If the DB connection is ambiguous, the verification stops before you can even question the Langfuse data model.
For the ClickHouse ingestion format, I used [JSONEachRow](https://clickhouse.com/docs/interfaces/formats/JSONEachRow). In ClickHouse documentation, this format treats each line as a separate JSON object. For batch-loading row data obtained from the Langfuse API, this shape is easy to handle.
For the table engine, I used [MergeTree](https://clickhouse.com/docs/engines/table-engines/mergetree-family/mergetree). The dataset in this verification is small, but trace logs grow over time. So I partitioned by `start_time` and put fields that are frequently used in searches into `ORDER BY`: `trace_name`, `prompt_version`, `model`, `start_time`, and `trace_id`.
```sql
CREATE TABLE llm_trace_observations
(
id String,
trace_id String,
trace_name LowCardinality(String),
observation_name String,
observation_type LowCardinality(String),
start_time DateTime64(3, 'UTC'),
prompt_version LowCardinality(String),
model LowCardinality(String),
input_tokens UInt32,
output_tokens UInt32,
total_tokens UInt32,
total_cost Decimal(18, 9),
latency_ms UInt32,
retry_attempt UInt8,
success Bool,
redaction_mode LowCardinality(String),
output_hash String,
tags Array(String)
)
ENGINE = MergeTree
PARTITION BY toYYYYMM(start_time)
ORDER BY (trace_name, prompt_version, model, start_time, trace_id);
```
I put Scores in a separate table. Another option would be to add Score columns horizontally to the Observation table. But Score types tend to increase, with axes such as `quality_score`, `task_success`, `safety_risk`, and `human_feedback`. I decided that keeping Scores vertical from the beginning makes it easier to add new Score names later.
## Aggregation Results Seen in ClickHouse
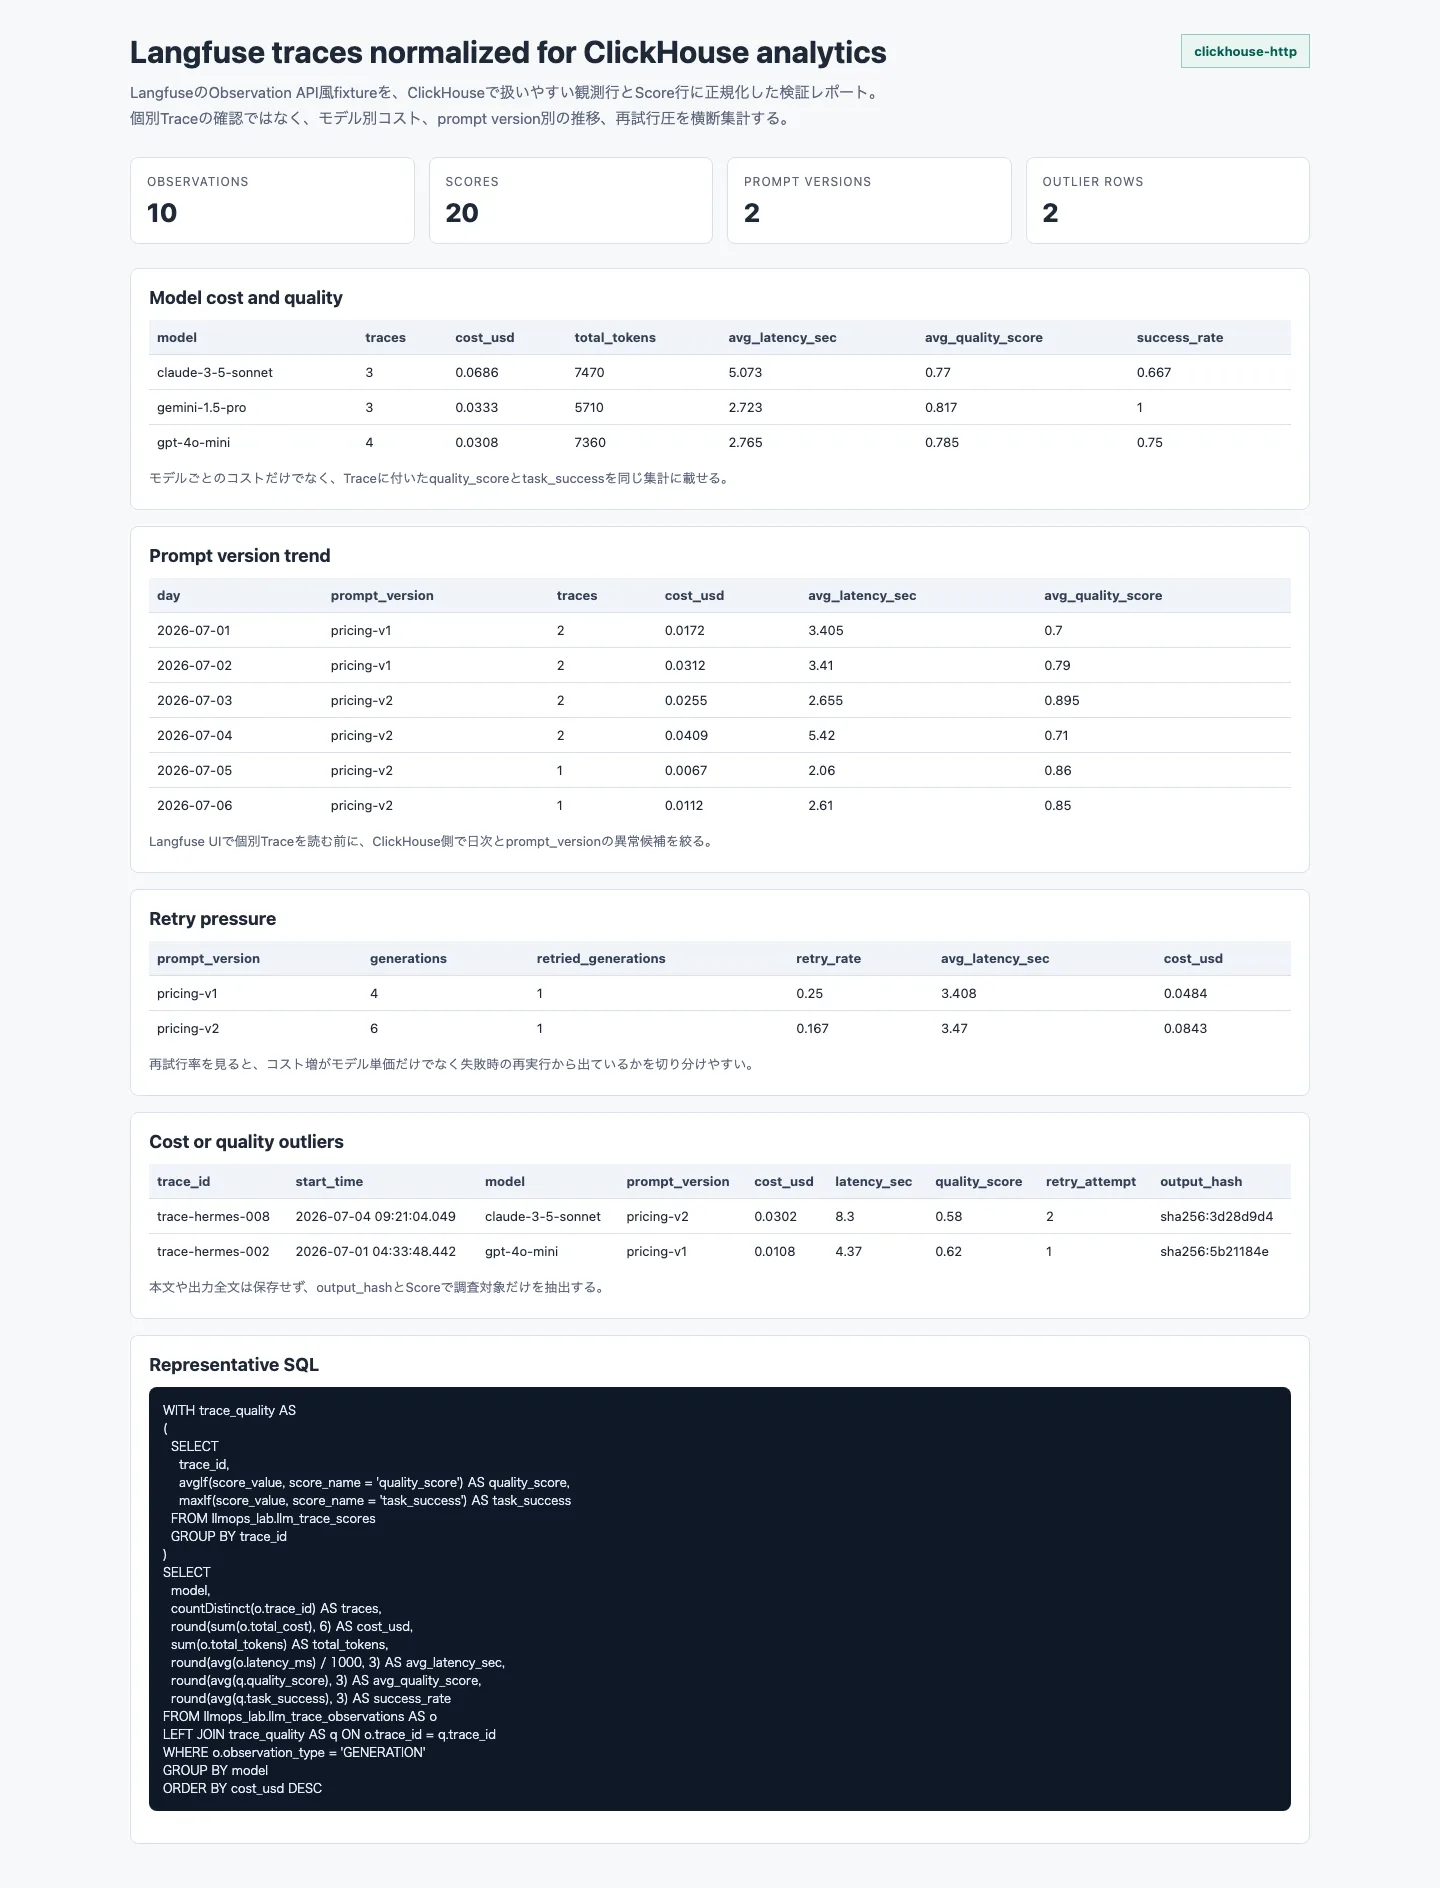
The execution result is summarized in the following report.
First, I put cost and quality by model into the same table.
| model | traces | cost_usd | total_tokens | avg_latency_sec | avg_quality_score | success_rate |
|---|---:|---:|---:|---:|---:|---:|
| claude-3-5-sonnet | 3 | 0.0686 | 7470 | 5.073 | 0.77 | 0.667 |
| gemini-1.5-pro | 3 | 0.0333 | 5710 | 2.723 | 0.817 | 1 |
| gpt-4o-mini | 4 | 0.0308 | 7360 | 2.765 | 0.785 | 0.75 |
Looking only at this table, `claude-3-5-sonnet` appears higher-cost and higher-latency. However, this does not mean "this model is bad." Looking at outliers later, one retry trace was pulling up the average.
Next is the daily trend by prompt version.
| day | prompt_version | traces | cost_usd | avg_latency_sec | avg_quality_score |
|---|---|---:|---:|---:|---:|
| 2026-07-01 | pricing-v1 | 2 | 0.0172 | 3.405 | 0.7 |
| 2026-07-02 | pricing-v1 | 2 | 0.0312 | 3.41 | 0.79 |
| 2026-07-03 | pricing-v2 | 2 | 0.0255 | 2.655 | 0.895 |
| 2026-07-04 | pricing-v2 | 2 | 0.0409 | 5.42 | 0.71 |
| 2026-07-05 | pricing-v2 | 1 | 0.0067 | 2.06 | 0.86 |
| 2026-07-06 | pricing-v2 | 1 | 0.0112 | 2.61 | 0.85 |
Immediately after switching to `pricing-v2`, on 2026-07-03, quality rose to 0.895 and latency shortened. But only on 2026-07-04, cost and latency jumped while quality dropped to 0.71.
Once you can see this, the investigation path changes. The question is no longer "was pricing-v2 a success or failure?" It becomes "pricing-v2 looks mostly good, but the outlier trace from 2026-07-04 should be inspected first." Opening the individual trace can come after that.
I also looked at retry rate.
| prompt_version | generations | retried_generations | retry_rate | avg_latency_sec | cost_usd |
|---|---:|---:|---:|---:|---:|
| pricing-v1 | 4 | 1 | 0.25 | 3.408 | 0.0484 |
| pricing-v2 | 6 | 1 | 0.167 | 3.47 | 0.0843 |
For `pricing-v2`, the retry rate is lower if you only look at that number. At the same time, total cost increased. You need to separate the increase in run count, the presence of outlier traces, and the difference in model pricing.
Finally, these are the outlier candidates.
| trace_id | model | prompt_version | cost_usd | latency_sec | quality_score | retry_attempt |
|---|---|---|---:|---:|---:|---:|
| trace-hermes-008 | claude-3-5-sonnet | pricing-v2 | 0.0302 | 8.3 | 0.58 | 2 |
| trace-hermes-002 | gpt-4o-mini | pricing-v1 | 0.0108 | 4.37 | 0.62 | 1 |
Once the target is narrowed this far, the traces to read in Langfuse UI become clear. There is no need to inspect the full text in ClickHouse. `trace_id`, model, prompt version, Score, retry attempt, and output hash are enough to decide which trace to inspect.
## SQL Creates the Entry Point for Investigation
A representative SQL query looks like this. It aggregates Observations by model and brings back `quality_score` and `task_success` from the Score table.
```sql
WITH trace_quality AS
(
SELECT
trace_id,
avgIf(score_value, score_name = 'quality_score') AS quality_score,
maxIf(score_value, score_name = 'task_success') AS task_success
FROM llm_trace_scores
GROUP BY trace_id
)
SELECT
model,
countDistinct(o.trace_id) AS traces,
round(sum(o.total_cost), 6) AS cost_usd,
sum(o.total_tokens) AS total_tokens,
round(avg(o.latency_ms) / 1000, 3) AS avg_latency_sec,
round(avg(q.quality_score), 3) AS avg_quality_score,
round(avg(q.task_success), 3) AS success_rate
FROM llm_trace_observations AS o
LEFT JOIN trace_quality AS q ON o.trace_id = q.trace_id
WHERE o.observation_type = 'GENERATION'
GROUP BY model
ORDER BY cost_usd DESC;
```
The purpose of this SQL is not to determine the root cause instead of Langfuse. It is to narrow down which model, prompt version, day, and trace ID deserve attention.
Langfuse UI is the place to inspect why a specific trace failed. ClickHouse is the place to decide which specific trace to inspect. With this order, the entry point for investigation stays manageable even as traces increase.
## Test the Design Without Storing Body Text First
In this fixture, I did not store prompt text or completion text. Instead, I stored only `output_hash`, tokens, cost, latency, retry attempt, and Scores.
This is not universally sufficient. There are cases where the generated text itself is necessary to investigate phrasing, business context, or a misunderstanding in user input. On the other hand, if you duplicate full text into ClickHouse from the beginning, retention scope, retention period, permissions, masking, and deletion-request handling all become heavier.
In this small verification, I could still make the following decisions without body text.
- Find high-cost models.
- See quality trends after prompt-version changes.
- Identify traces where retry attempts are pushing up cost.
- Extract trace IDs that are both low-quality and high-cost.
In other words, ClickHouse does not necessarily need to store full text to produce investigation candidates. When the body text is needed, return to Langfuse UI by `trace_id`. Starting with this division reduces the risk of broadening the public or internal data surface too much.
## Choose an Export Path Before Putting This into Operation
This verification started from a fixture, but in real operation you need to choose a data acquisition path.
If you want to start small, fetching bounded periods through Observations API v2 and inserting them into ClickHouse as JSONEachRow is straightforward. On the API side, you can constrain the range with `fromStartTime` and `toStartTime`, and select only the field groups you need. As a starting point, `usage`, `metrics`, `trace_context`, `model`, and `metadata` are useful candidates for cost and latency analysis.
If you need to export large volumes daily or hourly, Blob Storage Export is worth considering. The official documentation explains that traces, observations, enriched observations, and scores can be scheduled for export to S3, GCS, Azure Blob Storage, and similar destinations. Availability depends on the Cloud plan and self-hosted environment, so this needs to be checked before adoption.
On the ClickHouse side, you do not need to start with a complicated data warehouse. I felt that the following three tables are enough at first.
| Table | Role |
|---|---|
| `llm_trace_observations` | Time-series rows for generations, spans, and events |
| `llm_trace_scores` | Evaluation values tied to traces or observations |
| `llm_trace_daily_rollup` | Daily cost, latency, quality, and retry rate |
The daily rollup does not need to be built at the beginning. It can become a materialized view later, once queries get heavy. What should be fixed first is naming for `trace_id`, `observation_id`, `prompt_version`, `model`, `environment`, and `release`. If those drift, no amount of SQL will keep the investigation unit stable.
## Keep ClickHouse as the Place for Secondary Analysis
After analyzing Langfuse traces in ClickHouse, the role separation became clear.
Langfuse is suited to primary observation for LLM applications. It can track prompts, responses, Observations, and Scores by trace, so it is strong when reading one failed run.
ClickHouse is suited to long-term, cross-sectional analysis. It helps when traces need to be lined up horizontally, such as model-level cost, quality trends by prompt version, retry rate, and outlier candidate extraction.
In this verification, I inserted 10 Observations and 20 Scores into ClickHouse, then confirmed model-level cost, prompt-version trends, retry pressure, and outlier candidates with SQL. Because this is a fixture, the numbers themselves do not have general meaning. Still, the pattern of moving between Langfuse and ClickHouse around `trace_id` looks directly applicable to operational design.
Separate the place where you read individual traces from the place where you choose anomaly candidates from many traces. If LLMOps logs need to be useful over a long period, this separation is quite effective.